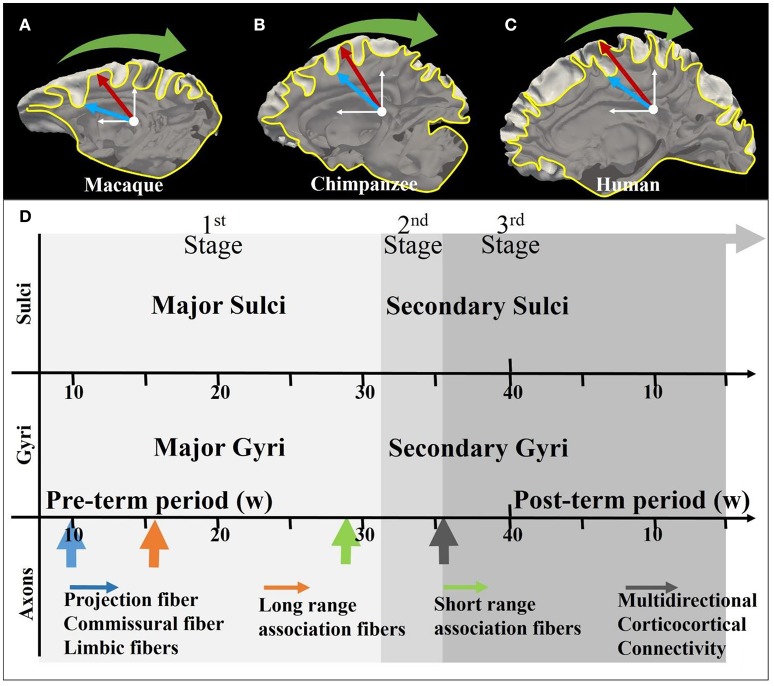
Figure 1.
(A–C) Illustration of the coordinate system on mature macaque, chimpanzee, and human cortical surface. The white axes indicate the stereoscopic coordinate system on sagittal planes. The yellow curves are the intersection lines of the cortical surface and the sagittal planes. The red arrows and blue arrows, respectively indicating gyri and sulci, point along radial directions on the sagittal plane. The green arrows suggest the circumferential directions; (D) Joint time course of gyrogenesis and axonogenesis of the human brain. The x-axis represents the timeline (see White et al., 2010 for explanations of the time segments). The arrows in the axon panel indicate the boosting time point of the specific type of axons. A detailed version of the time course chart can be found in Supplemental Figure 1.

