Figure 4.
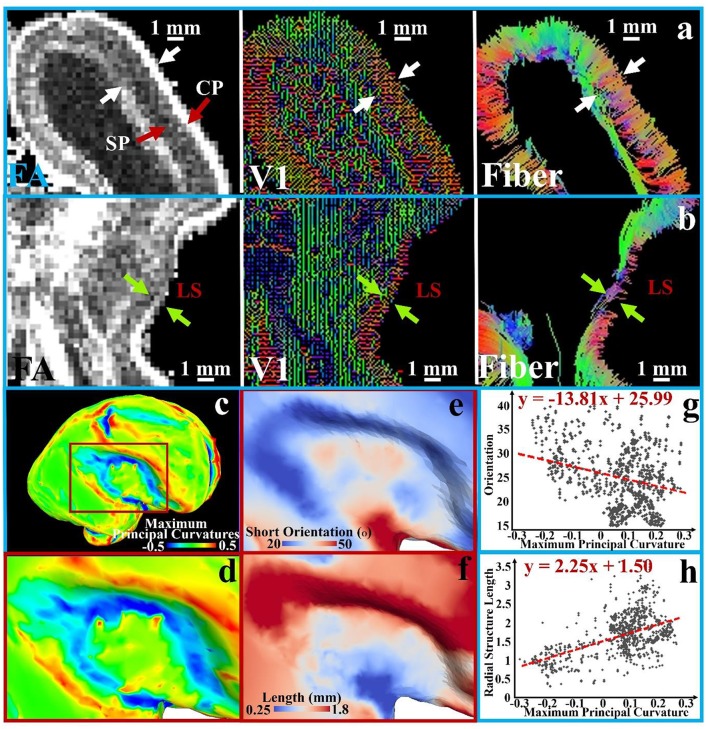
A transverse section is extracted from FA, V1, and tractography fiber maps of the 21 pcw fetus diffusion tensor imaging (DTI) data. An enlarged view of the occipital part of the brain is shown in (a) and LS part is in (b); white and green arrows in pairs indicate the thickness of subplate (SP) and cortical plate (CP); (c) The brain surface with maximum principal curvatures is reconstructed; (d) An enlarged view of the LS region with surface maximum principal curvatures; (e) The angles between average orientation of the short radial structures and the normal directions of the local surface regions on the LS regions; (f) The lengths of short radial structures are mapped to the LS regions. Short subcortical structures are defined as the streamline fibers shorter than 5 mm; (g–h) The measurements [angles in (e) and length in (f)] of sampled vertices in the LS regions are shown against the maximum principal curvatures in the scatter plots. A 1st order linear trend is estimated and illustrated by red dashed lines.

