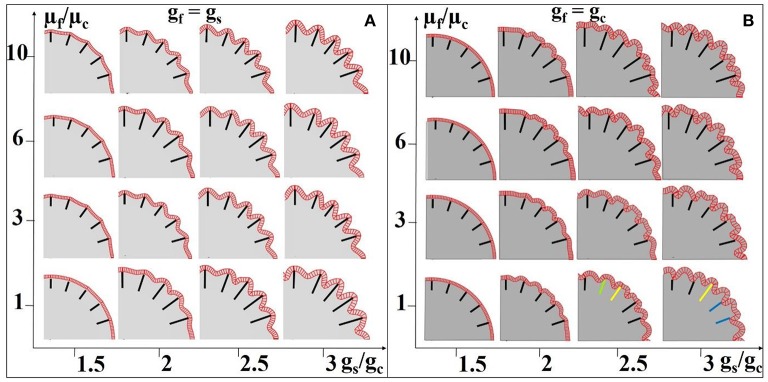
Figure 8.
Effect of axon density on the convolution patterns. Black and colored bars indicate regions where axons are denser than elsewhere in the core. The axon density is modeled by fiber stiffness in the computation model. The fibers growth speed is the same as the shell (gs) in (A) and the fiber growth speed is the same as the core (gc) in (B). A variety of growth speed ratios gs/gc (x-axis) and stiffness ratios between axons and the core μf/μc (y-axis) are considered. The stiffness values of the shell and core are the same for all cases. Yellow bars highlight convex convolution patterns, blue bars highlight concave convolution patterns and green bars highlight intermediate patterns.

