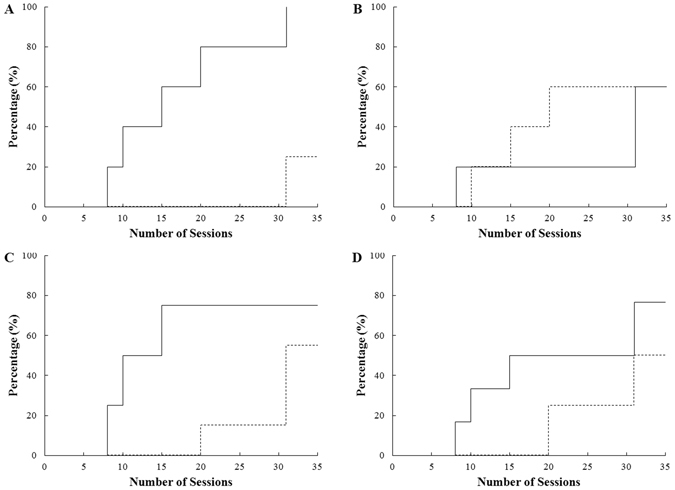
Figure 1.

The survival curve of the giant pandas meeting the first-stage criterion. (A) Cumulative proportion of young giant pandas (solid line) and older giant pandas (dashed line) that reached the criterion. (B) Cumulative proportion of giant pandas that reached the criterion in the angry group (solid line) and the happy group (dashed). (C) Cumulative proportion of giant pandas that reached the criterion when shown the upper face (solid line) and the lower face (dashed line). (D) Cumulative proportion of female giant pandas (solid line) and male giant pandas (dashed line) that reached the criterion.
