
Figure 5.
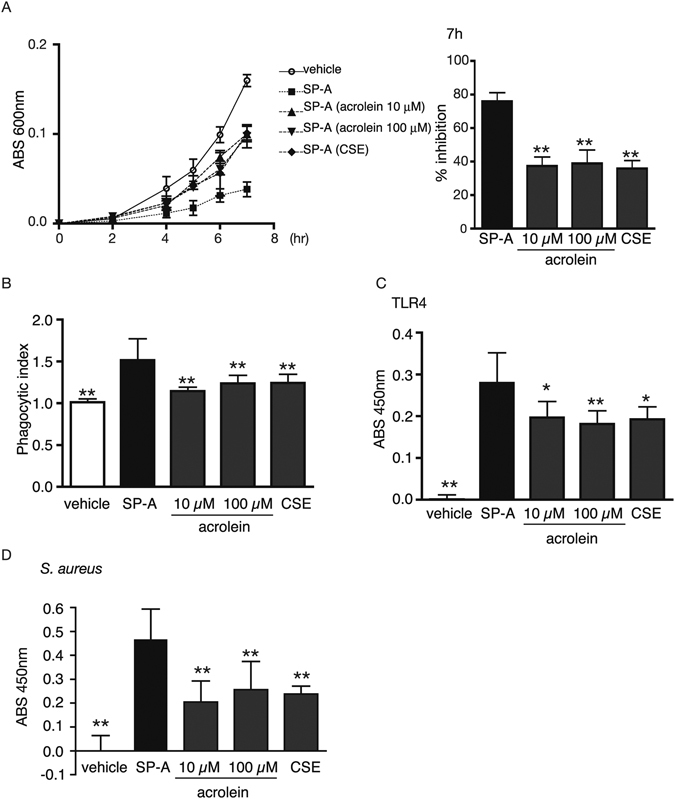
The CSE or acrolein modification of SP-A reduces SP-A–induced inhibition of E. coli growth and phagocytosis by RAW264.7 cells. Recombinant human SP-A (5 µM) was incubated with vehicle, acrolein (10 or 100 µM), or CSE (10%) at 37 °C for 4 h and then dialyzed to remove the excess unreacted CSE or acrolein. (A) Cultures of E. coli were mixed with vehicle or 10 µg/ml of unmodified SP-A, acrolein (10 or 100 µM)-modified SP-A, or CSE-modified SP-A and incubated at 37 °C for 7 h. E. coli growth was measured by absorbance at 600 nm (left). The growth inhibition rate of E. coli in non-modified SP-A at 7 h was referred to as 100% (right). n = 3 per group. **P < 0.01 vs. unmodified SP-A (n = 3). (B) RAW264.7 cells were treated with vehicle or 50 µg/ml of unmodified, acrolein (10 or 100 μM)-modified or CSE-modified SP-A for 2 h. The supernatant was removed, and the cells were incubated with fluorescein-labeled E. coli particles for 2 h. The phagocytic index is a measure of the fluorescence intensity of experimental samples relative to the fluorescence intensity of vehicle-treated cells. **P < 0.01 vs. unmodified SP-A (n = 3). (C) The binding ability of SP-A to hTLR4. hTLR4 was used to coat microplates, and 5 μg of unmodified, acrolein (10 or 100 μM)-modified, or CSE-modified SP-A was incubated in the plates for 5 h. The binding affinity of SP-A for S. aureus was determined by using anti-SP-A polyclonal antibody. The background absorbance (vehicle treated-hTLR4) was subtracted. *P < 0.05, **P < 0.01 vs. unmodified SP-A (n = 3). (D) The binding ability of SP-A to S. aureus. UV-killed S. aureus was coated onto microplates and incubated with vehicle or 2.5 µg of unmodified, acrolein (10 or 100 μM)-modified, or CSE-modified SP-A for 1 h. The binding ability of SP-A to S. aureus was assessed with anti-SP-A polyclonal antibody. The background absorbance (vehicle treated-S. aureus) was subtracted. **P < 0.01 vs. unmodified SP-A (n = 4). All values shown are the mean ± SD. Statistical significance was determined by using a non-parametric two-way ANOVA followed by Bonferroni’s multiple comparison test.