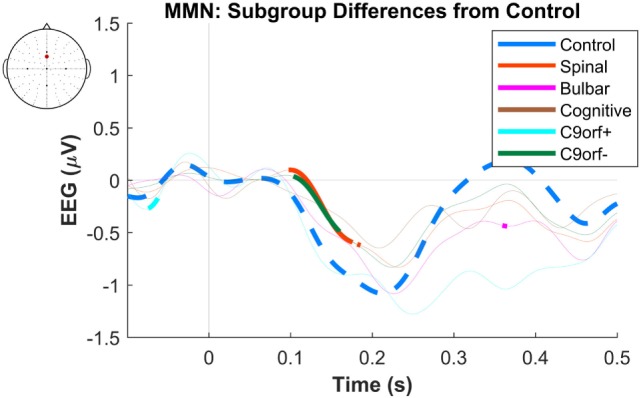
Figure 5.

Difference of early average mismatch negativity (MMN) between controls and individual amyotrophic lateral sclerosis subgroups. The between-group differences correspond to each time-point of EEG in a frontocentral electrode located between FCz and Fz. The thick curves indicate time windows where the differences against the control waveforms are significant. See text for statistics and significance (p < 0.05).
