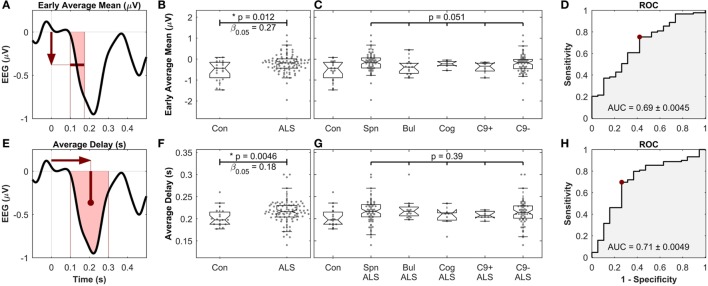
Figure 6.
Early average mean [top, (A–D)] as well as the average delay [bottom, (E–H)] of mismatch negativity (MMN), showing significant differences between controls and amyotrophic lateral sclerosis (ALS) patients, but not between ALS subgroups. (A,E) Schematic of the definition of the MMN waveform measures. (B,F) Comparison between healthy controls and all ALS patients. (C,G) Comparison between ALS subgroups. “Con,” “Spn,” “Bul,” “Cog,” “C9+,” and “C9−” stand for control, spinal, bulbar, cognitive/ALF-FTD, C9ORF72 positive and C9ORF72 negative subgroups, respectively. (D,H) ROC curve, comparing the discriminatory power, the optimal level of sensitivity–specificity (red dot), as well as the area under the curve (AUC), achieved for linear discrimination of controls and ALS patients of each measure. See text for methods and statistics.

