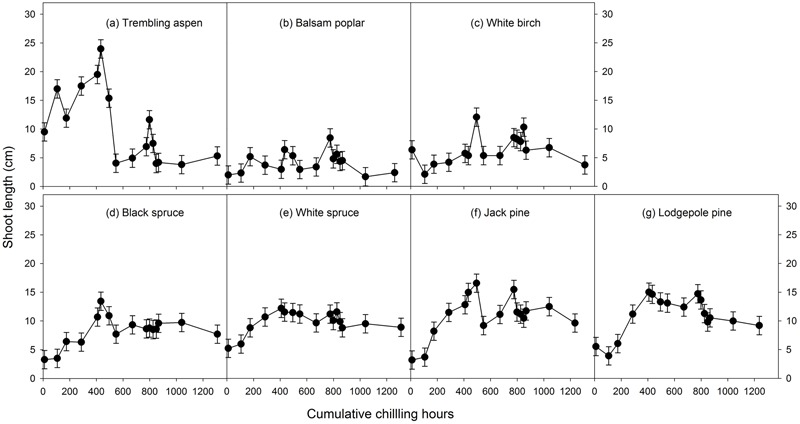
FIGURE 5.

The relationships between chilling accumulation (cumulative weighted chilling hours since September 29) and shoot growth (length of longest new shoot within a month of budburst, least square means ± SE) from 16 budburst experiments conducted sequentially from October 1 (left, climate chambers) to May (right, outdoor conditions) for seven tree species (a–g).
