Figure 1.

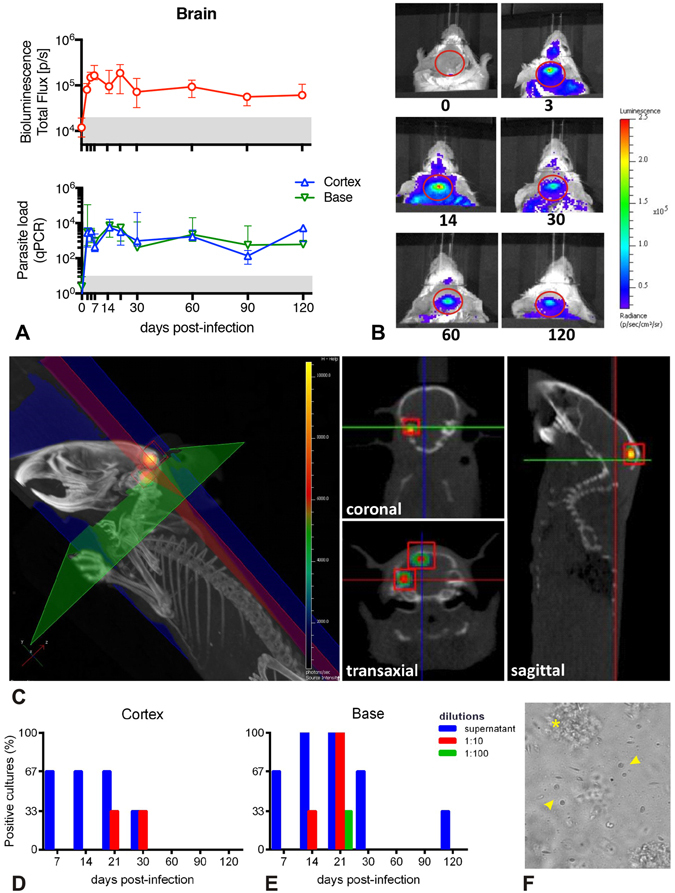
Parasite detection in the brain of BALB/c mice infected with Leishmania donovani. (A) Kinetics of the parasite load in the brain detected by bioluminescence (upper panel) and in the cortex and base detected by RT-qPCR (bottom panel). The grey area corresponds to background signals. Data are represented as median and the interquartile range. (B) Representative images illustrating the 2D-bioluminescence analysis of the parasite detection in the brain at specific time points post infection. The regions of interest (ROIs) corresponding to the brain are represented as red circles. (C) In vivo tridimensional micro-computed tomography to localize the bioluminescence signals within the brain. Representative tridimensional reconstruction of an infected mouse skeleton at 120 days post infection exhibiting the x-axis (blue), y-axis (green) and z-axis (red), and two bioluminescent foci (red cubes). The cross-sectional images exhibit the coronal (z-axis), transaxial (y-axis) and sagittal (x-axis) views and allow the localization of both bioluminescent foci within the cranial cavity (red squares). See also Movie S1. (D,E) Parasite isolation from brain tissue. Percentage of positive parasite cultures from the cortex (D) and from the base (E) of infected BALB/c mice brains, according to different dilutions and time points (n = 3/time point). (F) Representative image of a parasite culture from a cortex at day 7 post infection, where it is possible to observe Leishmania donovani promastigotes with different morphologies (arrowhead) surrounded by cellular debris (*).
