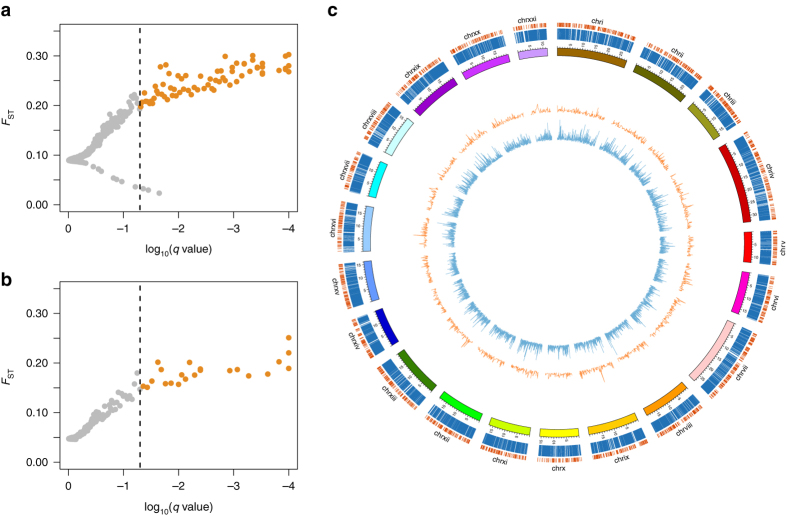
Fig. 2.
Genomic population divergence in eight coexisting populations of the three-spined and nine-spined stickleback. BAYESCAN outlier detection in data sets containing a 12,754 SNPs for the three-spined and b 10,090 SNPs for the nine-spined stickleback. Genetic divergence (F ST) of each locus is plotted against the log-transformed q value. Loci in orange are classified as candidates under divergent selection. Loci in grey are classified as neutral or are candidates under balancing selection. c Map of the three-spined stickleback genome. The outermost (orange) and second outermost (blue) bars represent the mapped genotyped loci in the nine-spined and the three-spined stickleback, respectively. The coloured blocks represent the different linkage groups. The orange (nine-spined stickleback) and blue (three-spined stickleback) inner circles represent line charts showing F ST for all SNPs throughout the genome

