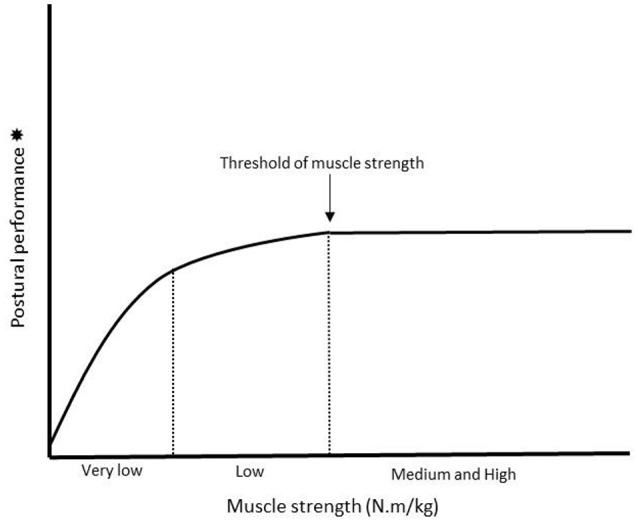
Figure 1.

Illustration of the relationship between lower-extremity muscle strength and postural performance in static postural condition. An increase in muscle strength corresponds to an increase in postural performance until a certain threshold above which this relationship disappears (indicated by the arrow on the figure). Firstly, the curve would have a linear shape (i.e., for subjects presenting the lowest level of lower-extremity muscle strength i.e., “very low” zone on the figure) whereas secondly, it would tend to flatten (i.e., for subjects presenting a level of muscle strength slightly higher i.e., “low” zone on the figure). Thirdly, the curve would become horizontal (i.e., for subjects presenting the highest level of lower-extremity muscle strength i.e., “medium and high” zone on the figure). In fact, this curve would mean that the lower the level of muscle strength, the stronger the relationship between lower-extremity muscle strength and postural performance. *When postural performance is evaluated through the recording of displacements of the center of foot pressure (COP), the level of performance is inversely proportional to the surface area (in mm2) of displacement of the COP i.e., the smaller the surface, the better the postural performance (Paillard and Noe, 2015).
