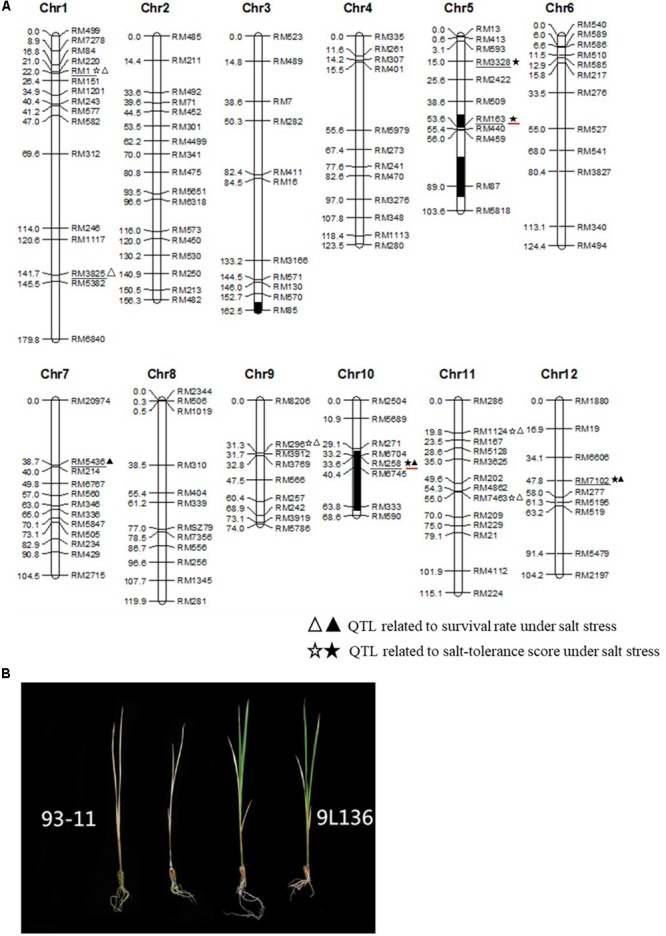
FIGURE 2.

Chromosomal location of salt tolerance-related QTLs (A) and the 9L136 and 93-11 phenotypes treated with 125 mM NaCl for 9 days (B). Symbols on the right of chromosomes indicate the positions of putative QTLs for salt tolerance-related traits. The closed symbols indicate that the O. rufipogon-derived alleles conferred a positive effect on salt tolerance-related traits, and the open symbols indicate a negative effect. The markers related to QTLs for salt tolerance are underlined with black. In the graphical genotypes, the black regions indicate homozygous regions from Chaling common wild rice in 9L136 and the white regions indicate homozygous regions for recurrent parent 93-11. The QTLs enhancing salinity tolerance and located on the introgressed region in 9L136 are underlined with red.
