
FIGURE 3.
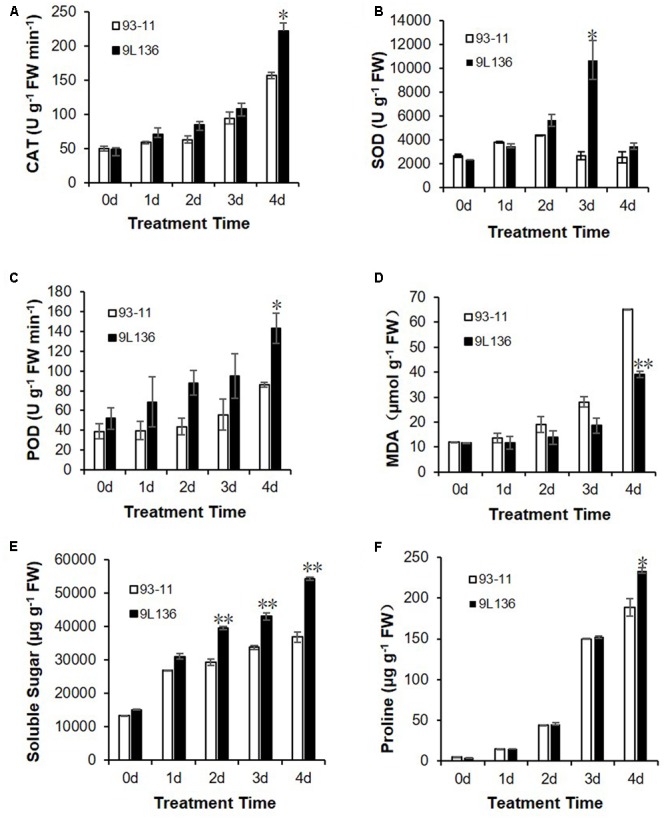
Comparison of physiological characteristics between salt-tolerant line 9L136 and recurrent parent 93-11 under salt stress conditions (125 mM NaCl). Physiological characteristics included the activities of catalase (CAT) (A), superoxide dismutase (SOD) (B), peroxidase (POD) (C), and malondialdehyde (MDA) (D), and the contents of soluble sugars (E) and proline (F). Data are means ± standard deviation with three replicates. Asterisks represent significant differences between 93-11 and 9L136 using Student’s t-test: ∗P < 0.05 and ∗∗P < 0.01.