
Figure 1.
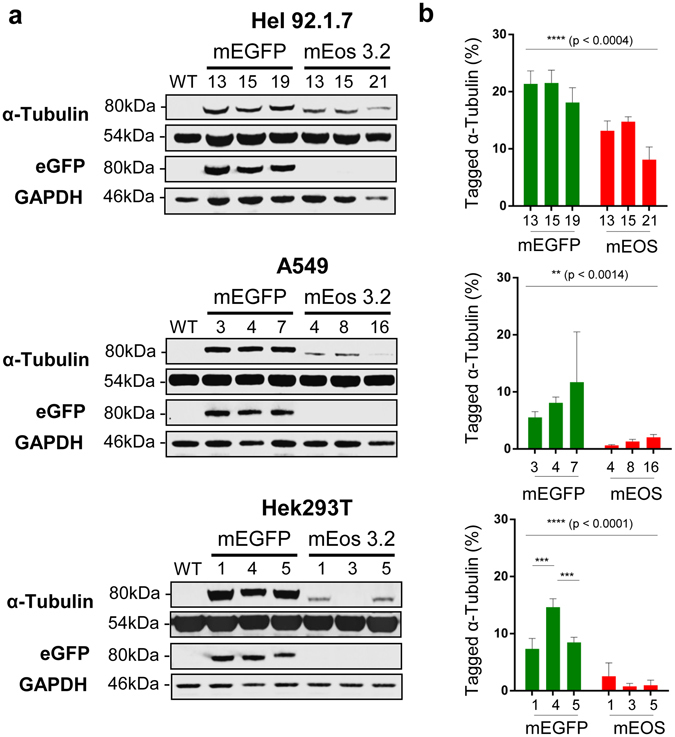
Western blotting and quantitation of tagged α-tubulin mEGFP and mEos 3.2 clones. (a) All three cell lines express a tagged α-tubulin at the predicted molecular weight of approximately 80 kDa. Use of an anti-GFP antibody detects these bands in eGFP expressing clones. (b) All three cell lines demonstrate a significant difference in expression between eGFP and mEos 3.2 tagged TubA1B (****p < 0.0004 in Hel 92.1.7, **p < 0.0014 in A549, and ****(p < 0.0001), with little clone to clone variation in the samples tested. Statistical testing performed through a Two-Way ANOVA with multiple comparisons (Tukey). Full length western blots and quantitation of endogenous TubA1B expression levels are supplied in Supplementary Fig. 6 and 7.