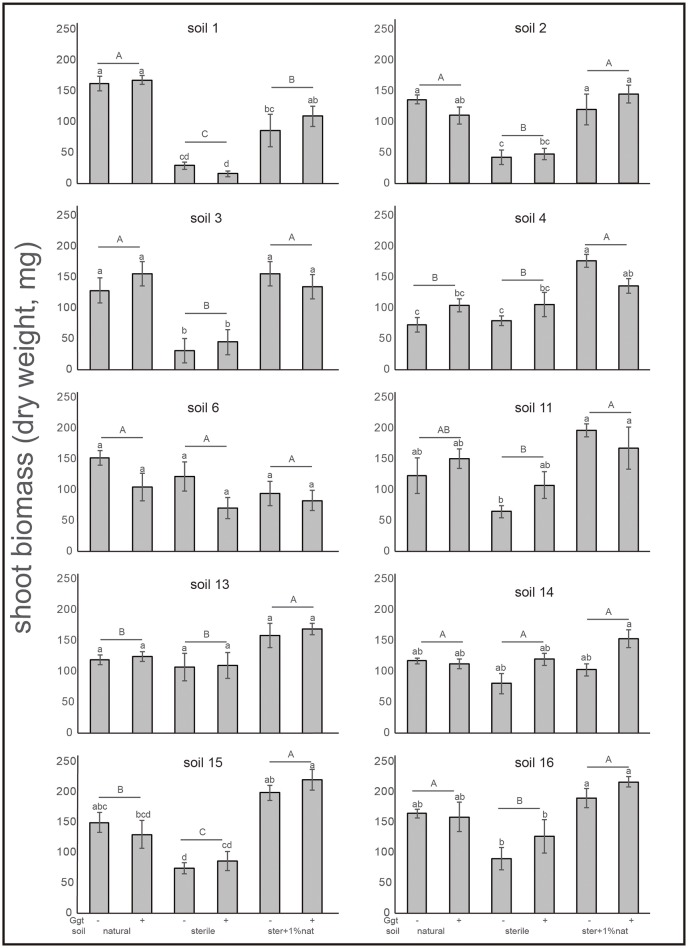
Figure 6.
Shoot biomass (dry weight) of wheat plants from suppressive soil assay in greenhouse. Treatments were: natural soil (natural), sterile soil (sterile), and sterile soil supplemented with 1% of natural soil (ster+1% nat)- and inoculated (+) or not (−) by Ggt (n = 5). Tukey's test was used to compare treatments means, values followed by the same letter do not differ at P ≤ 0.05 (n = 5).

