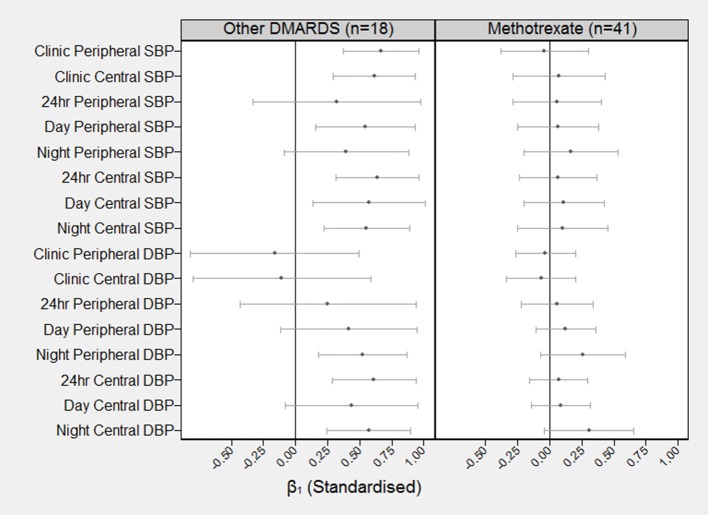
Figure 2.
Standardized coefficients (and 99.7% confidence intervals) describing the correlation between baseline PWV and BP at follow-up BP (β1). The standardized β1 can be interpreted as the number of SD increases in BP at 8 months for each one SD increase in PWV at baseline. For example, the standardized β1 coefficient for baseline PWV on clinic peripheral SBP for the other DMARDS group is β1 = 0.66 (99.7% CI = 0.37–0.96).

