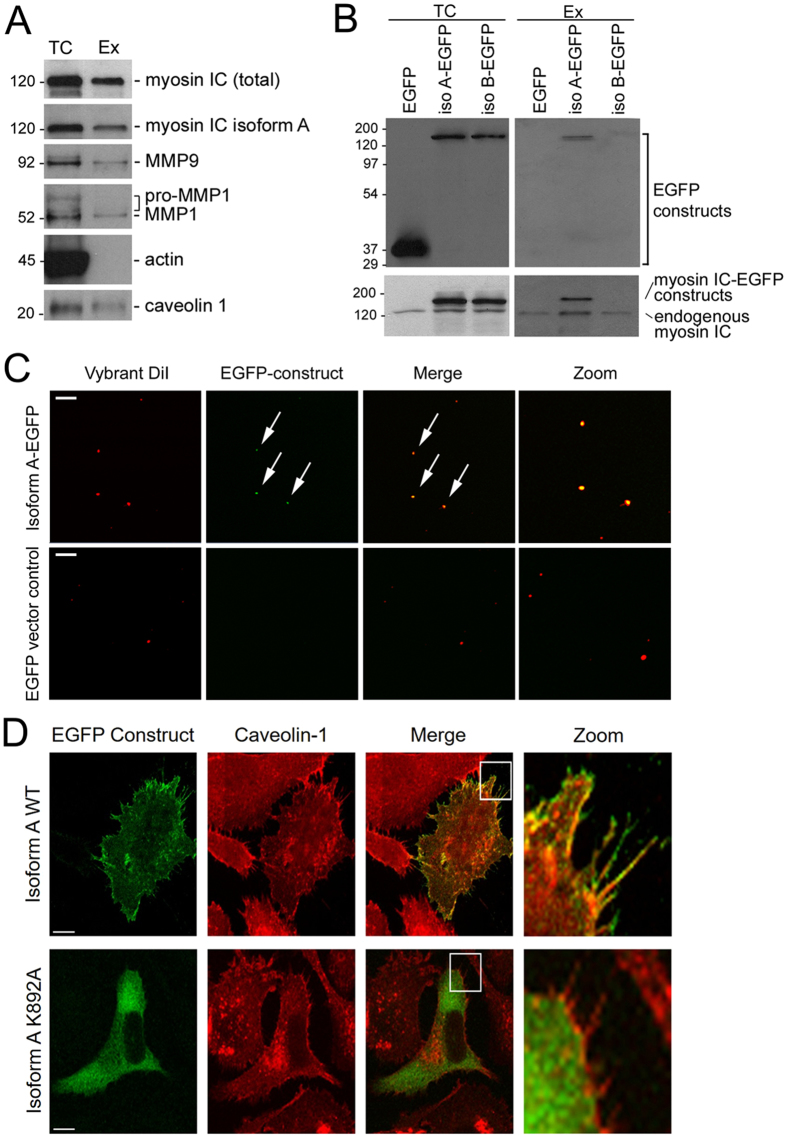
Figure 1.
Localization of myosin IC isoform A in prostate cancer cells and exosomes. (A) Western blot analysis of total cell (TC) extract and secreted exosomes (Ex) of PC3 cells. Left labels: molecular weight in kDa. Right labels: antibody targets. (B) Western blot analysis of total extract and exosomes of PC3 cells transfected with EGFP-tagged isoforms A and B of myosin IC or with EGFP alone. Top panels: probed with anti-EGFP antibody. Bottom panels: probed with anti-myosin IC (non-isoform specific) antibody. (C) Fluorescence microscopy images of purified exosomes of PC3 cells transfected with EGFP-tagged isoform A or EGFP alone. Membrane visualized with Vybrant DiI dye. Arrows: vesicles displaying colocalization of the two fluorescent signals. Zoom: central area of image to the left, magnified. (D) Relative localization of EGFP-tagged isoform A with caveolin 1 in PC3 cells. Caveolin is visualized by indirect immunofluorescence. WT, wild type. K892A, substitution in the lipid-binding domain. Scale bars in (C,D) – 10 µm.

