Figure 3.
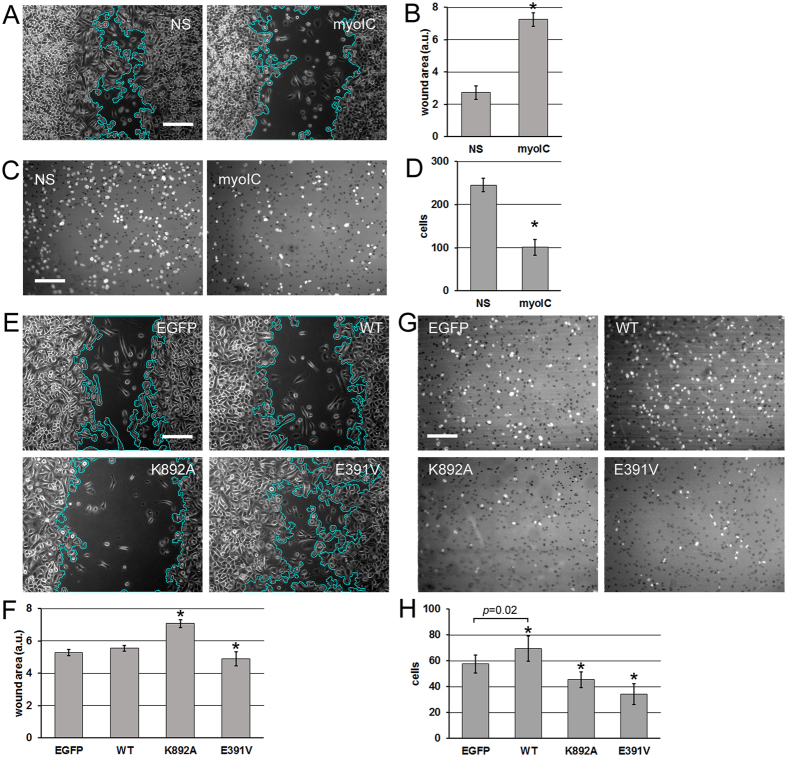
Effects of myosin IC and isoform A on motility and invasion of prostate cancer cells. (A) In-vitro wound closure experiment on PC3 with the siRNA knockdown. Scratched and healing cell monolayers were photographed in phase contrast 24 h after scratching. Representative fields are shown. Wound area outline in cyan is overlaid by the software used for the automated measurement. (B) Quantification of the experiment in A. Error bars: 95% c.i. on the mean. N = 40 camera fields per group. Experiment reproduced 4 times. (C) Matrigel invasion experiment on PC3 cells with the siRNA knockdown. Nuclei of cells that have invaded across the reconstituted extracellular matrix layer were visualized by DAPI staining and fluorescence microscopy. Representative fields are shown. (D) Quantification of the experiment in (C). Error bars: 95% c.i. on the mean. N = 36 camera fields per group. Experiment reproduced 4 times. (E). In-vitro wound closure experiment on PC3 cells expressing the isoform A constructs or EGFP as the treatment control. Visualization as in (A). (F) Quantification of the experiment in (E). Error bars: 95% individual c.i. on the mean. N = 52 camera fields per group. Experiment repeated 4 times. (G) Matrigel invasion experiment on PC3 cells expressing the isoform A constructs. Visualization as in (C). (H) Quantification of the experiment in (G). Error bars: 95% individual c.i. on the mean. *Significant (p < 0.05) deviations from the control. One-tailed p-values in pairwise comparisons with the EGFP control are: WT – indicated on the graph, K892A – 0.005, E391V – <0.0001. If regarded as a multiple comparison, each null hypothesis of equality to the control is rejected on the familywise significance level 0.05 using the Holm-Bonferroni correction. Scale bars in (A,E,C,G) – 200 µm.

