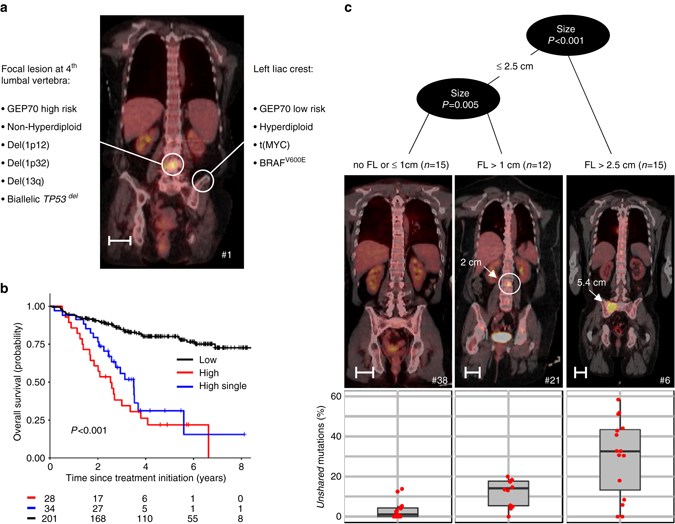
Fig. 3.

Spatial heterogeneity: example, impact on outcome and association with the size of focal lesions. In a, unshared key drivers and the risk status in paired samples of patient no. 1 are shown. b Overall survival after enrollment into Total Therapy for 263 patients stratified by the GEP70 risk status in a routinely collected iliac crest sample and a paired CT-guided fine needle aspirate. Whereas black and red indicate patients with GEP70 low- and high-risk in both samples, respectively, the blue line shows the outcome for patients with discrepancies for paired samples (single-site high-risk). In c, recursive partitioning with the maximum size of focal lesions as the predictor of the proportion of unshared mutations was performed. Representative PET-CT images for the three size-groups are depicted (length of scale bars = 5 cm)
