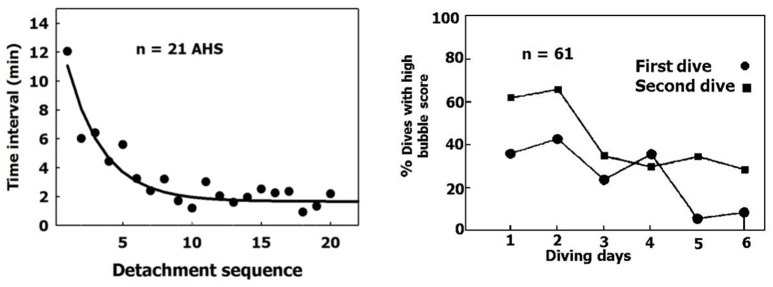
Figure 12.
Activation of AHS. (Left) Time intervals between bubble detachments from the AHS as a function of the sequence of detachment from the same AHS. The first value is the time from decompression (adapted from Arieli and Marmur, 2014 with permission). (Right) Percentage of high bubble grades after the first and second dives on the same day (adapted from Dunford et al., 2002 with permission).

