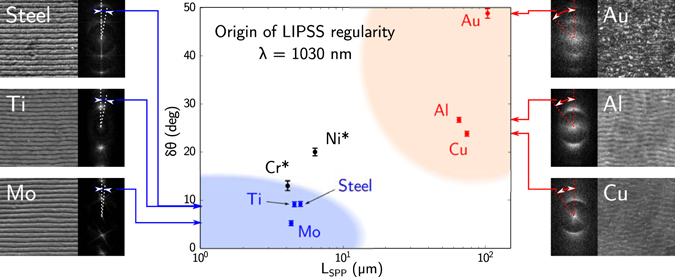
Figure 2.

DLOA δθ as a function of the calculated mean free path L SPP of SEW. SEM images obtained with the same magnification are shown for metals studied in this paper (irradiation conditions are given in Table 1) with the corresponding 2D-FT images. Note that the angular sizes displayed on the 2D-FT are comparable to but not as precise as the DLOA used here. Asterisks stand for DLOA δθ data for Cr and Ni, estimated from the images of refs 15 and 26 respectively. Vertical error bars were evaluated from the convergence of the DLOA δθ (see Materials and Methods). The LIPSS fabricated in this work, which exhibit high and low regularities, are marked respectively by blue and pink. Materials located in the blue-colored area (respectively in pink-colored area) are suitable (respectively non-suitable) for the HR-LIPSS formation.
