
Figure 2.
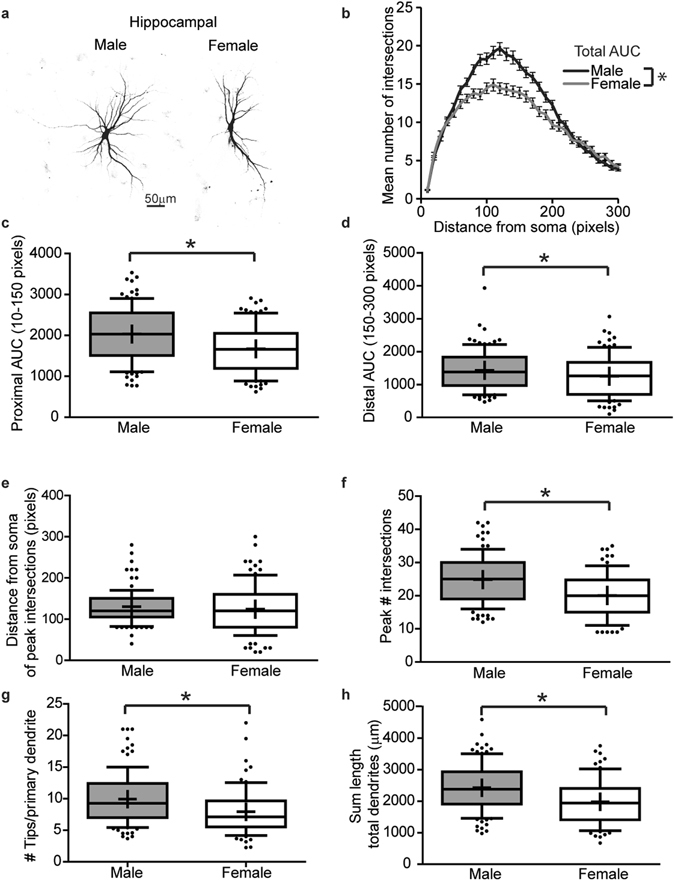
In vitro, dendritic arbors are more complex in male vs. female hippocampal neurons. Sex-specific neuron-glia co-cultures were established from P0 male and female mouse hippocampi, transfected with MAP2B-GFP plasmid on day in vitro (DIV) 6 and fixed on DIV 9. Representative images (a) and Sholl plot (b) of DIV 9 GFP-positive male and female hippocampal neurons. Dendritic morphology was assessed by quantifying: (b) the total area under the curve (AUC) in Sholl plots (10–300 pixels from the soma); (c) area under the proximal portion of the Sholl curve (10–150 pixels from the soma); (d) area under the distal portion of the Sholl curve (150–300 pixels from the soma); (e) distance from the soma at which the peak number of dendritic intersections occurs; (f) the peak number of dendritic intersections; (g) the number of terminal dendritic tips per primary dendrite; and (h) the total dendritic length per neuron. In the box plots (c–h), “+” indicates the mean; whiskers, the 10–90th percentile, (n = 76–101 neurons per sex from at least five independent dissections). Significant differences were determined using Student’s T-test for parametric data (b,c,f,h) and Mann-Whitney U test for nonparametric data (d,e,g). Asterisk indicates a significant difference between groups at p ≤ 0.05. AUC = area under the curve. Magnification; 0.65 microns per pixel.