
Fig. 2.
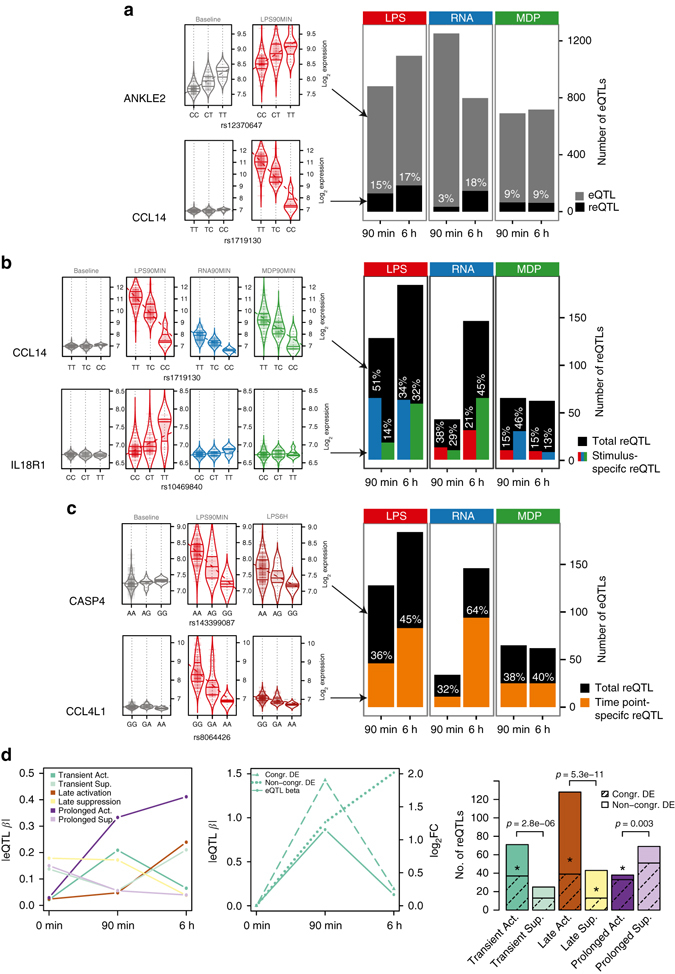
Immune response eQTL study in human monocytes. a Total numbers of cis eQTLs and proportions of reQTLs of LPS-treated (LPS), 5′-ppp-dsRNA (RNA) and MDP-treated (MDP) monocytes at 90 min and 6 h after stimulation. Results of the analysis of 134 individuals are shown unless indicated otherwise. eQTLs include all genes with a significant genetic association in each stimulated condition, and reQTLs are a subset that show a significant difference of the regression slope between untreated and stimulated monocytes, with violin plots shown as examples. The untreated condition has 1653 eQTLs that are not shown in the bar plot. b Numbers of reQTLs and proportions of treatment-specific reQTLs where the regression slope of the tested treatment is different from the slope of the other two treatments within the same time point, with violin plots shown as examples and the color of bar indicating the treatment that was tested. c Numbers of reQTLs and proportions of time point-specific reQTLs where the regression slope of the tested time point is different from the slope of the other time point within the same treatment, with violin plots shown as examples. d reQTLs were divided into six subsets according to their temporal activity (see Methods section). Average of absolute eQTL effect sizes per category is shown on the left panel. The middle panel illustrates a reQTL example with congruent differential expression (DE) (dashed line) or non-congruent DE (dotted line) of the eGene. reQTL distribution to different categories is shown in the right panel, where the shaded portion illustrates the proportion of reQTLs with congruent DE of the eGene and asterisks represent the significance of enrichment of reQTLs with congruent DE of the eGene (Fisher’s exact test *p<0.05). The p-values above the bars indicate the significance between of active and suppressive types (binomial test)