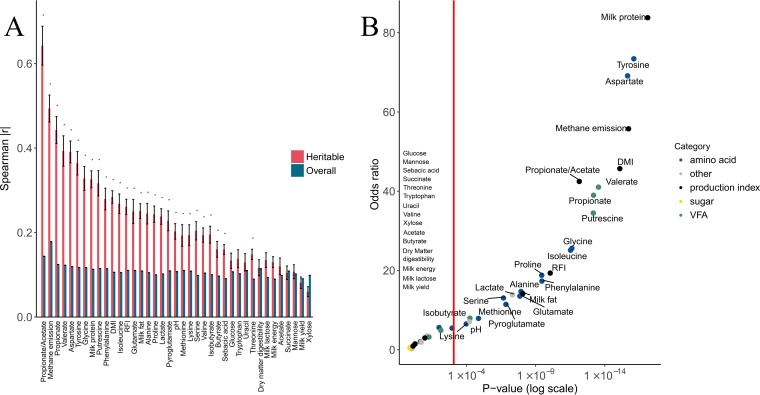
FIG 4 .
Heritable OTUs are more closely connected to host physiology and rumen metabolites than other rumen microbes. (A) The mean absolute correlation (Spearman) of the heritable OTUs with a given index is compared with that of the entire microbiome. Asterisks represent significant differences in means (t test, P < 0.05). Red bars represent correlations of the heritable microbiome, while the blue bars represent correlations of the entire microbiome. (B) The odds ratio for an OTU to be correlated with a given index (nominal Spearman P of <0.05), between the heritable OTUs and all OTUs. y axis, odds ratio; x axis, P value derived from Fisher’s exact test. The red vertical line defines the Bonferroni-corrected 0.05 significance threshold. Point colors signify category according to the legend.

