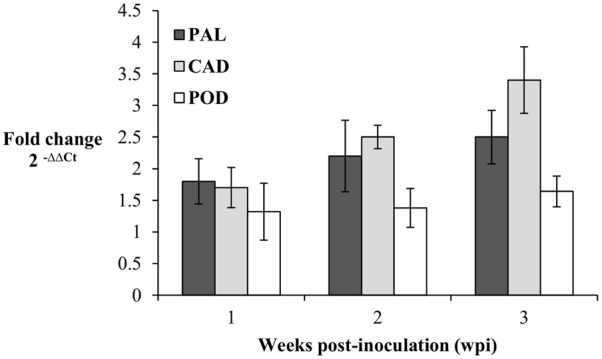
FIGURE 5.

Expression pattern of PAL, CAD, and POD genes in Ganoderma boninense infected oil palm seedlings at 1, 2, and 3 wpi. Fold change (FC) values are computed relative to control (non-inoculated) seedlings. Bars represent mean ± standard error of four biological replicates.
