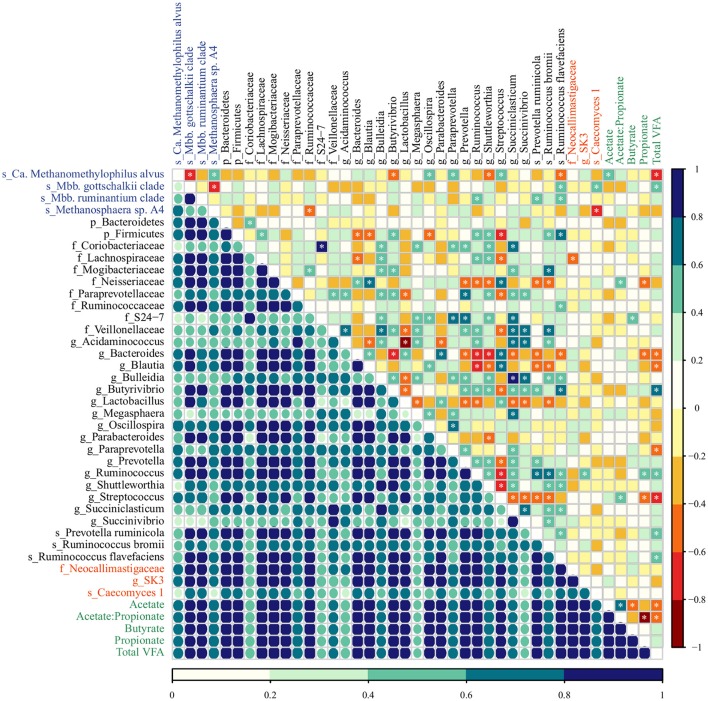
Figure 3.
The co-occurrence and correlation among archaeal (blue), bacterial (black), fungal (red) taxa, and molar proportions of volatile fatty acids (green) in the rumen samples of M-fed calves. The co-occurrence is shown by Dice's index (lower matrix), ranging from 0 to 1, represented by color key (dark blue: high, seagreen: moderate, light blue: low co-occurrence). The correlation is shown by Spearman's rank correlation (upper matrix), ranging from −1 to 1 and represented by color key dark red (perfect negative correlation) to dark blue (perfect positive correlation). The correlations marked with asterisks are significant at a P < 0.05 (Supplementary Table 7).

