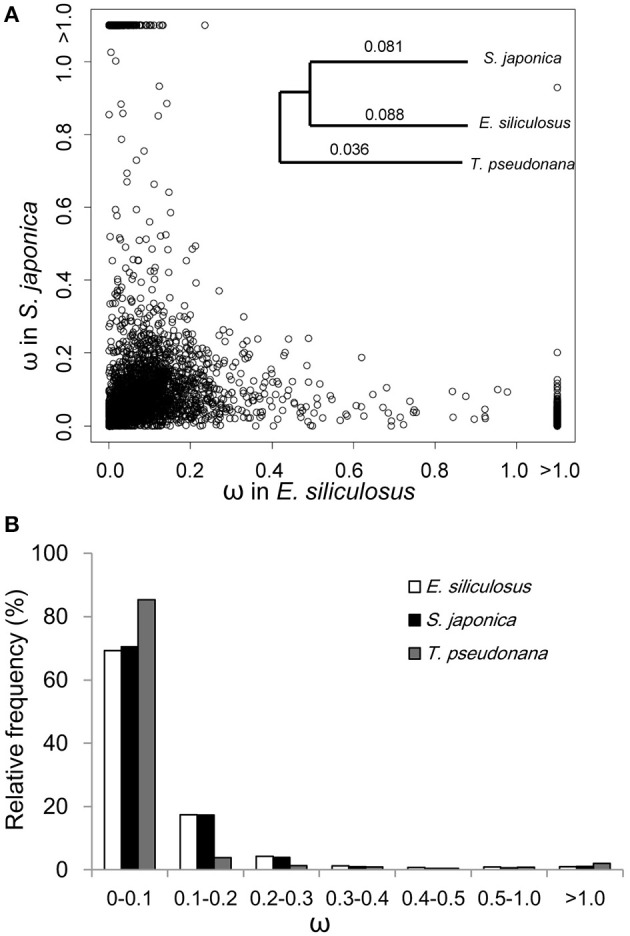
Figure 1.

ω distribution of orthologous genes among E. siliculosus, S. japonica and T. pseudonana. (A) Scatter plot showing the ω distribution of genes in E. siliculosus and S. japonica, respectively. The species tree on the upper right panel is used in the branch model analysis as well as the site and branch-site model. Numbers on the tree branch denote the average ω of the three species. (B) Frequency distributions of ω of the three species.
