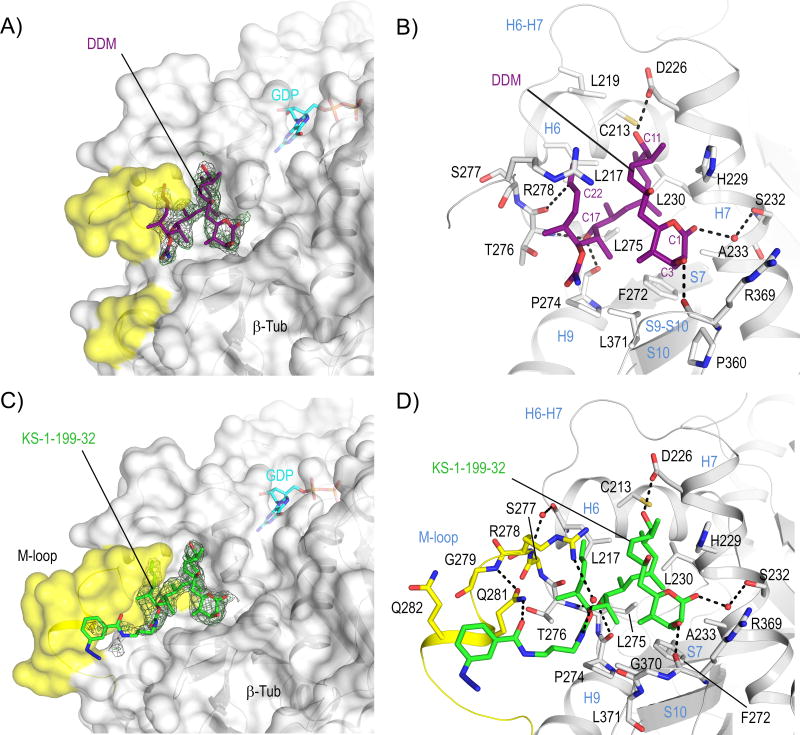
Figure 1. Structures of tubulin-DDM and tubulin-KS-1-199-32.
Overall views of (A) tubulin–DDM and (C) tubulin-KS-1-199-32 interactions. The β-tubulin –––subunits (chain B) are shown in surface representation. The M-loop residues are highlighted in yellow. All ligands are in stick representation and are colored in purple (DDM) and green (KS-1-199-32). The SigmaA-weighted 2mFo-DFc (grey mesh) and mFo-DFc (green mesh) omit maps are contoured at + 1.0 σ and + 3.0 σ, respectively. Close-up view of the interactions observed between (B) DDM, (D) KS-1-199-32 and β-tubulin in stick and ribbon representation, respectively.

