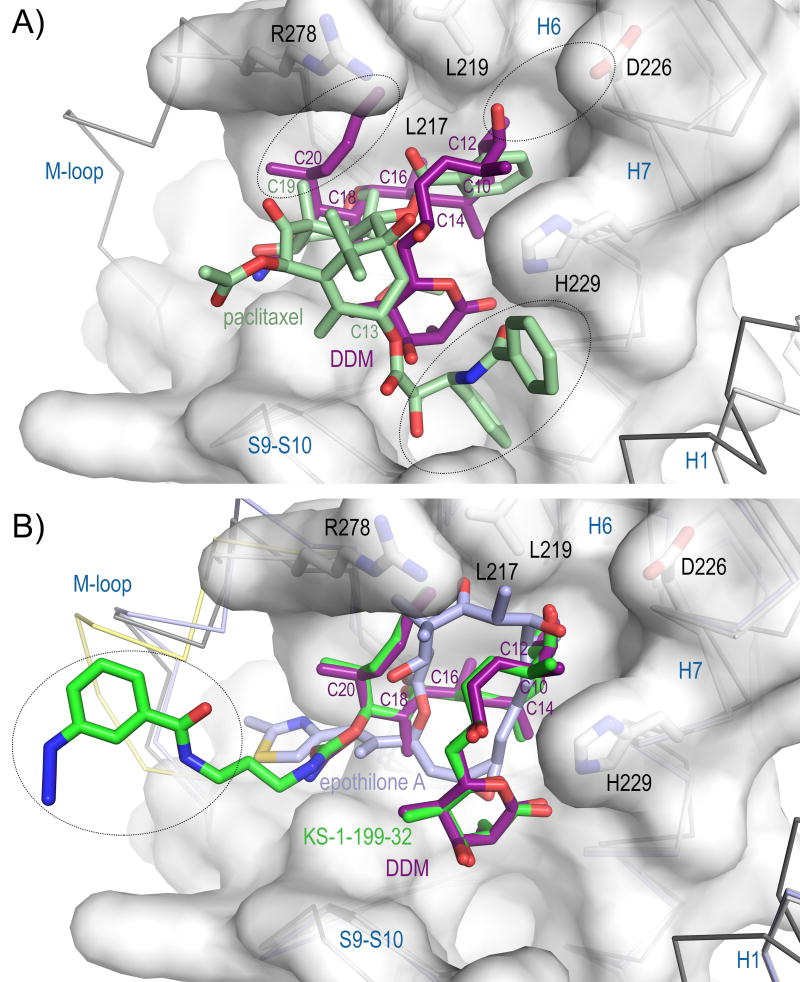
Figure 2. Tubulin binding of DDM and KS-1-199-32 compared to paclitaxel and EpoA.
(A) Close-up view of the superimposed paclitaxel-stabilized microtubule (dark grey ribbon, white surface, PDB ID 3J6G) and tubulin–DDM (light gray ribbon) complexes. The black ellipsoids denote the regions of the taxane site where differences are observed. (B) Same close-up view as in (A), but with superimposed KS-1-199-32 (green) and EpoA (slate, PDB ID 4I50). The M-loop of the superimposed KS-1-199-32-structure is highlighted in yellow.

