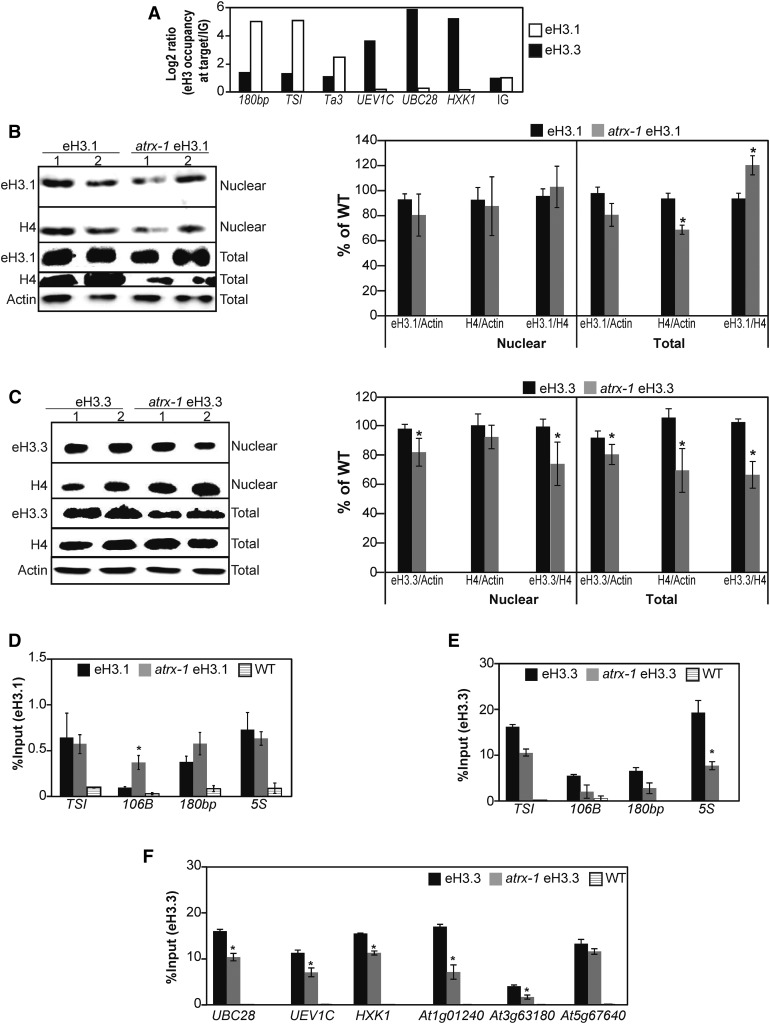
Figure 5.
Effect of ATRX Loss on Incorporation and Balance of the Canonical Histone H3.1 and the H3.3 Variant.
(A) Canonical eH3.1 and variant eH3.3 occupancy at heterochromatic repeats (180bp, TSI, and Ta3) and at three active genes (UBC28, UEV1C, and HXK1) assessed by ChIP-qPCR in one biological replicate sampled at the same time for each genotype and consisting of a pool of 0.5 g of 2.5-week-old in vitro-grown plants. The eH3.1 and eH3.3 occupancy is normalized to the occupancy at an intergenic region (IG; set to 1).
(B) and (C) Left: Histone eH3.1 (B) and eH3.3 (C) protein levels quantified by immunoblot in nuclear fractions and total extracts prepared with Honda buffer (Honda et al., 1966). Six micrograms of proteins were loaded per lane. Right: Quantification of H4 and eH3.1 (B) or eH3.3 (C) band intensities relative to Actin in total extracts from two independent experiments comprising in total four biological replicates of pools of 1 g of 2.5-week-old in vitro-grown plants and several blots. Student’s t test compared with the wild type; *P < 0.05.
(D) and (E) Histone eH3.1 (D) and eH3.3 (E) occupancy at heterochromatic repeats (TSI, 106B, and 180bp) and at the 5S ribosomal DNA loci assessed by ChIP-qPCR in three biological replicates sampled at the same time and consisting of pools of 1 g of 2.5-week-old in vitro-grown eH3.1, atrx-1 eH3.1, and wild-type plants. Student’s t test compared with the wild type; *P < 0.05.
(F) Histone eH3.3 occupancy at three active genes (UBC28, UEV1C, and HXK1) and at three genes situated in subtelomeric regions (At1g01240, At3g63180, and At5g67640) assessed by ChIP-qPCR in the same plant material as in (E). Student’s t test compared with the wild type; *P < 0.05.
Error bars of all panels represent se of the mean.

