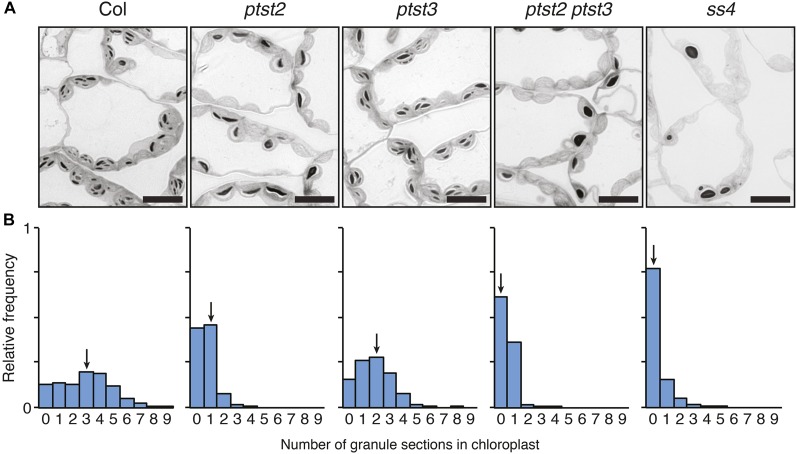
Figure 5.
Number of Starch Granules per Chloroplast in the ptst2 and ptst3 Single and Double Mutants.
The ptst2-3 and ptst3-5 alleles were used for all experiments in this figure.
(A) Starch granules in chloroplasts observed with light microscopy in leaf sections stained with toluidine blue. Leaves were harvested at the end of the day. Similar phenotypes were observed in three independent experiments performed on different batches of plants. Representative images are shown. Bars = 10 µm.
(B) Quantification of granule sections within chloroplasts. Light micrographs were acquired as in (A), and the number of starch granules observed within each chloroplast section was counted. Histograms show the frequency of chloroplasts containing a given number of granule sections relative to the total number of chloroplasts analyzed (n = 540 for each genotype). Equal numbers of chloroplasts were analyzed in leaves from three different plants for each genotype. Arrows indicate the bin containing the median value.

