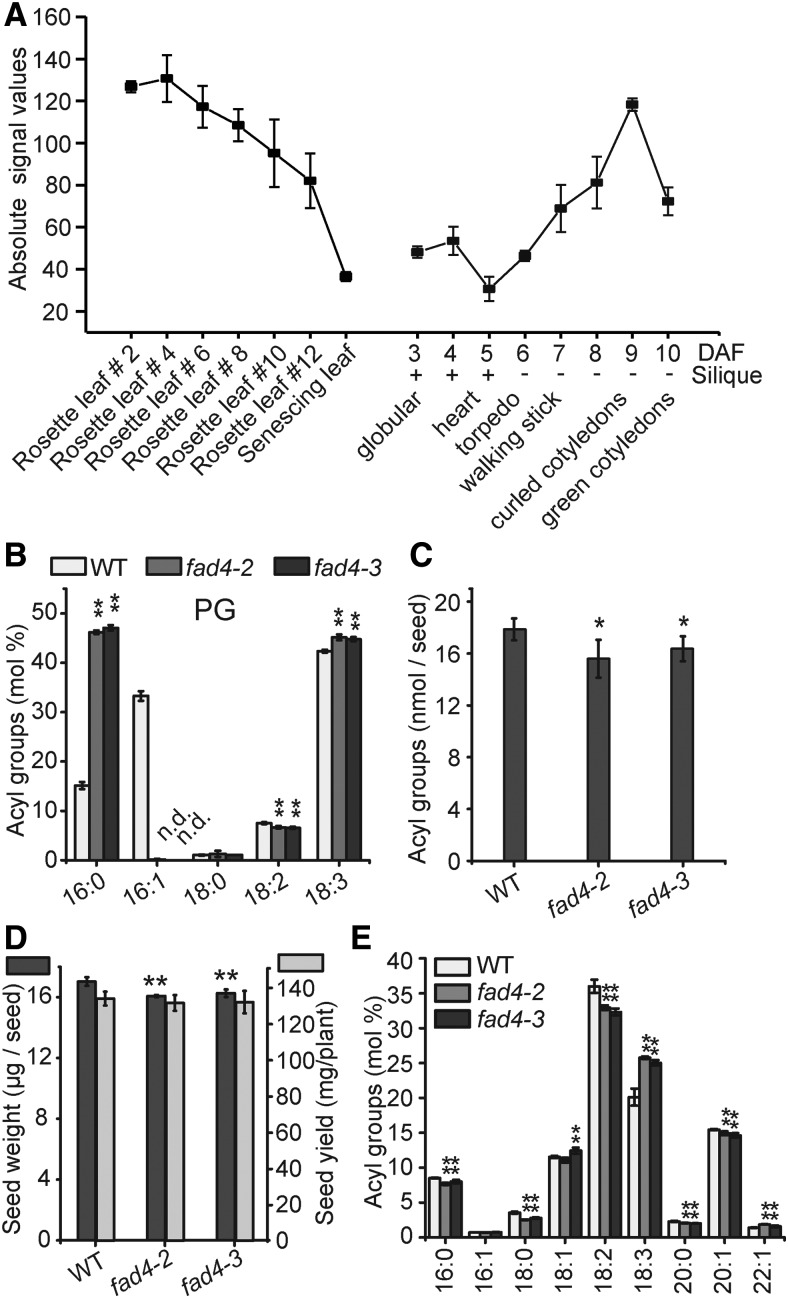
Figure 8.
Analysis of fad4-2 and fad4-3 Plants.
(A) Absolute expression levels of FAD4 in leaves and developing seeds at different stages. Data were extracted from the Arabidopsis eFB browser. Average values from triplicates are shown, and the error bars represent sd.
(B) Leaf PG acyl group composition of 3-week-old MS-medium-grown wild-type, fad4-2, and fad4-3 plants. Leaves harvested from one plant were pooled as one biological repeat; n = 3 to 4, ±sd. n.d., not detected.
(C) Total acyl group content in dry seeds of the wild type, fad4-2, and fad4-3. Thirty seeds were used for each repeat; n = 5, ±sd.
(D) Seed weight and yield measurements of wild-type, fad4-2 and fad4-3 plants. For seed weight measurement, 200 seeds were used for each repeat, n = 3, ±sd. For seed yield measurement, seeds harvested from four plants grown in the same pot were used as one repeat, n = 3, ±sd.
(E) Relative acyl group composition of seed lipid extracts from of the wild type, fad4-2, and fad4-3. 30 seeds were used for each repeat, n = 5, ±sd. Acyl groups with a molar percentage less than 0.5% were omitted. Where appropriate, Student’s t test was used to compare the wild type and each fad4 mutant (*P < 0.05; **P < 0.01).

