Figure 9.
Phenotypic Analysis of PLIP1-OX1 Embryos.
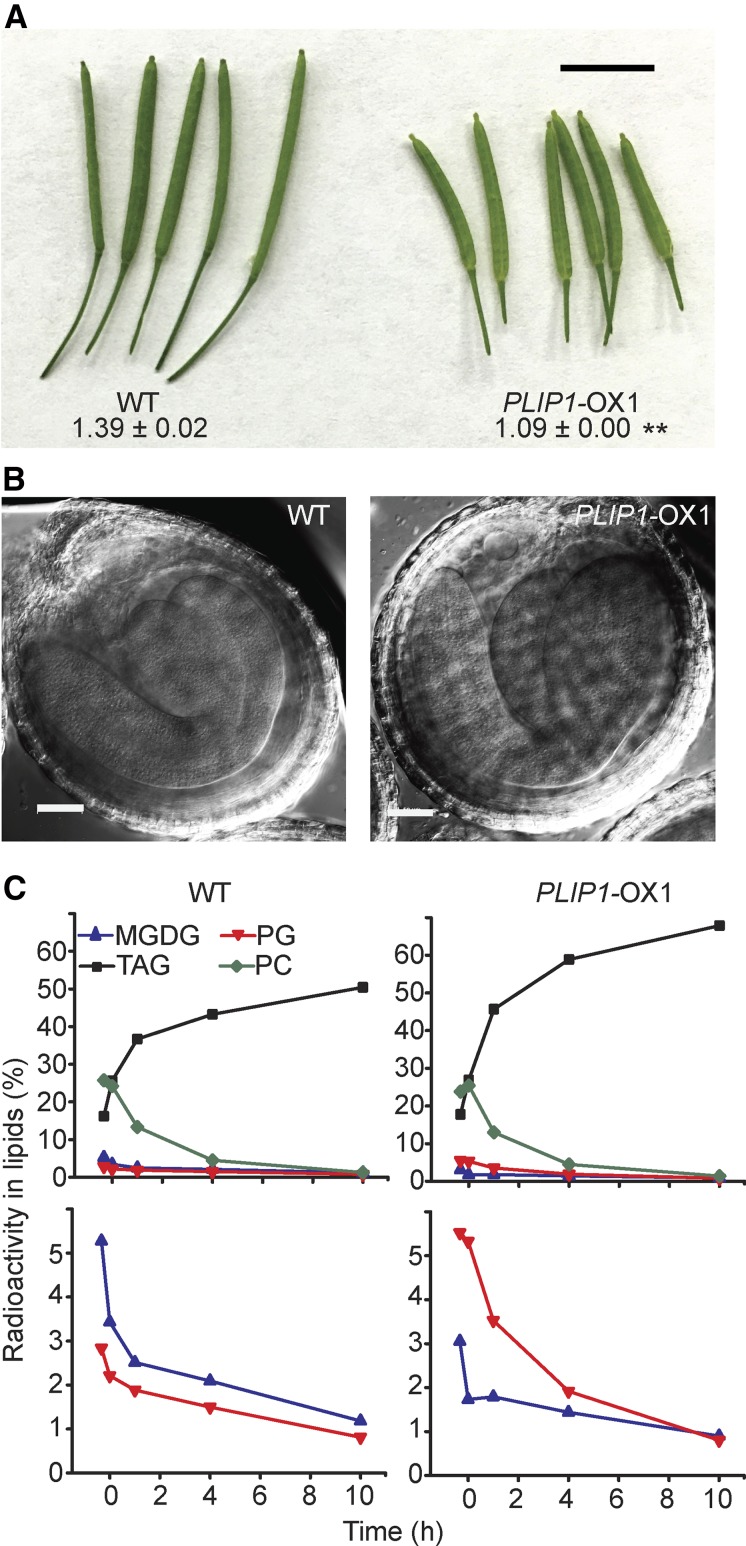
(A) Morphology of the wild-type and PLIP1-OX1 siliques 9 d after flowering. The numbers indicate the length of siliques. n = 9 to 12, ±sd. Student’s t test was applied (**P < 0.01). Bar = 0.5 cm.
(B) Differential interference contrast images of embryos isolated from siliques of WT and PLIP1-OX1 plants. Bars = 50 µm. Representative images are shown.
(C) Pulse-chase labeling of developing embryos isolated from siliques of wild-type and PLIP1-OX1 plants. Equivalent volume (100 μL) of developing seeds were used for each time point. The first two time points represent the labeling pulse. Embryos were transferred to unlabeled medium after 1 h. Values represent the fraction of label in select individual lipids compared with label in total lipids. The top panels show four lipids, as indicated. The lower panels show PG and MGDG again, but on an expanded scale. Experiments were repeated three times on PLIP1-OX1 seeds and one time on PLIP1-OX2 seeds, with similar results. One representative result is shown.

