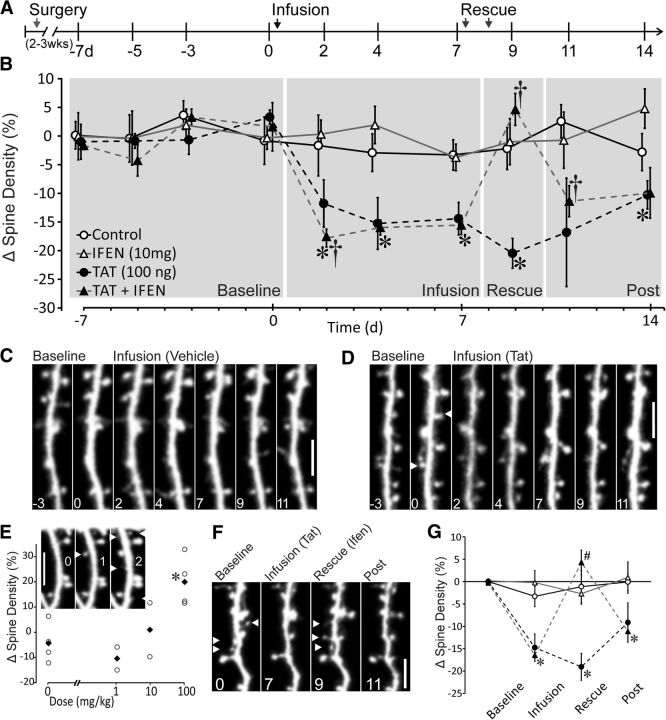
Figure 2.
Infusion of HIV-1 Tat induces loss of dendritic spines and ifenprodil rescues Tat-induced spine loss. A, Schematic representation of time course of experiment illustrates timing of surgery, imaging sessions, and ifenprodil administration relative to vehicle or Tat infusion. B, Time course showing changes in spine density (%) relative to mean density of 4 baseline images (day −7, −5, −3, 0). Control subjects (n = 5, open circles) received vehicle infusion (PBS) on day 0 and received saline injections on days 7 and 8. Tat subjects (n = 5, solid circles) received 100 ng of Tat in 2 μl of PBS on day 0 and received saline injections on days 7 and 8. Ifenprodil control subjects (n = 5; ifen; open triangles) received vehicle infusion on day 0 and received ifenprodil injections (10 m/kg, i.p.) on days 7 and 8. Subjects that received Tat followed by ifenprodil (n = 5; Tat + ifen; solid triangles) received 100 ng of Tat in 2 μl of PBS on day 0 and received ifenprodil injections (10 m/kg, i.p.) on days 7 and 8. †Significant within-group change in spine density relative to previous imaging session. *Significant difference relative to control group. Data are shown as mean ± SEM. C, Representative image sequence demonstrating the stability of spines during baseline imaging sessions and continued stability after PBS infusion (vehicle). D, Representative micrographs showing Tat-induced loss of dendritic spines. White arrows denote locations of spines present on day 0 that were lost after Tat infusion (days 2, 4, and 7). Scale bars, 50 μm. n = 5 for all groups. E, Scatter plot showing dose-dependent effects of ifenprodil administered at the indicated dose twice by intraperitoneal injection on spine density. Data are shown as mean (solid black diamonds) and individual data points (hollow circles). Abscissa is log scale, with 0 mg/kg inserted for reference. *Significant difference from saline-treated control group (n = 2–4 for each concentration). Inset, Representative micrographs of dendritic segment showing ifenprodil-induced gain of spines from before ifenprodil (0), after the first injection of 100 mg/kg ifenprodil (1), and after the last injection of ifenprodil (2). White arrows indicate new spines. Scale bar, 5 μm. F, Representative micrographs of Tat-induced loss and ifenprodil induced recovery of dendritic spines. White arrows denote locations of spines present at baseline and lost after Tat infusion and new spines that appear after ifenprodil rescue that were not present after infusion. Note loss of spines after rescue on day 11. Scale bar, 5 μm. n = 5 for all groups. G, Binned data from all groups analyzed with repeated-measures ANOVA to evaluate loss and rescue effects. Gray shading in B shows time periods analyzed in the following groups: baseline (days −7 through 0), infusion (days 2–7), rescue (day 9), and postinfusion (days 11–14). Data are shown as means ± SEM, *Significant difference between control and Tat-infused treatment conditions. #Significant difference from Tat-infused treatment group.

