
Figure 3.
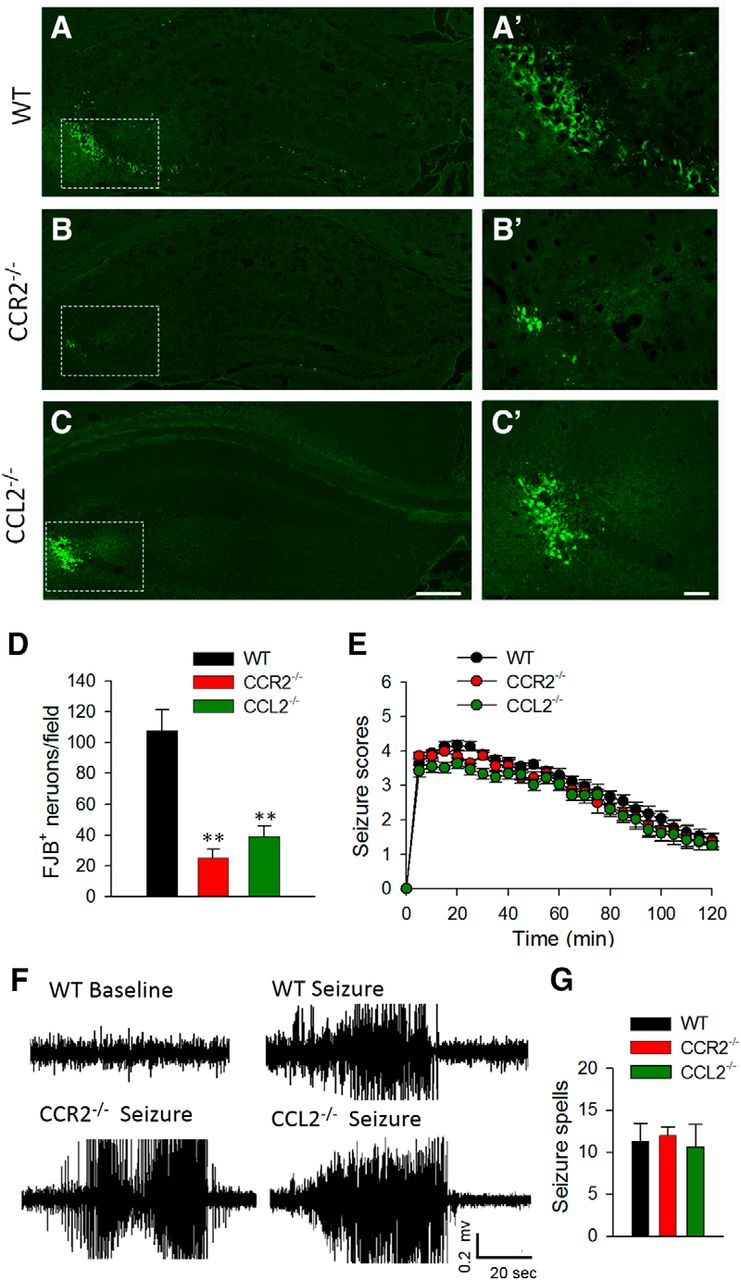
Decrease in the number of degenerated neurons in CCR2−/− mice and CCL2−/− mice 1 d after KA treatment. A–C, FJB staining was used to detect neuronal degeneration in the hippocampus 1 d after KA treatment in WT (A), CCR2−/− (B), and CCL2−/− (C) mice. Scale bar, 100 μm. A', B', C', Magnified images for the rectangles shown in A–C, respectively. Scale bar, 50 μm. D, Quantification of number of FJB-positive neurons in WT, CCR2−/−, and CCL2−/− mice 1 d after KA-induced seizures. n = 4 for each group, **p < 0.01. E, Seizure scores 0–2 h after intracerebroventricular delivery of KA in WT, CCR2−/−, and CCL2−/− mice. n = 9 in WT, n = 6 in CCR2−/−, and n = 6 in CCL2−/− mice, p > 0.05. F, Representative EEG traces from awake WT, CCR2−/−, and CCL2−/− mice before intracerebroventricular KA injection (baseline) and with stage 4 seizures after intracerebroventricular KA injection (seizure). G, The histogram depicts total seizure spells detected between 0 and 2 h after KA administration in WT, CCR2−/−, and CCL2−/− mice. Seizure spells were defined as high-frequency, high-voltage synchronized polyspike or paroxysmal sharp waves with amplitude >2-fold background and lasting >6 s. The peak-to-peak amplitude cutoff was set at 1000 μV. n = 3 for each genotype of mice.