
Figure 4.
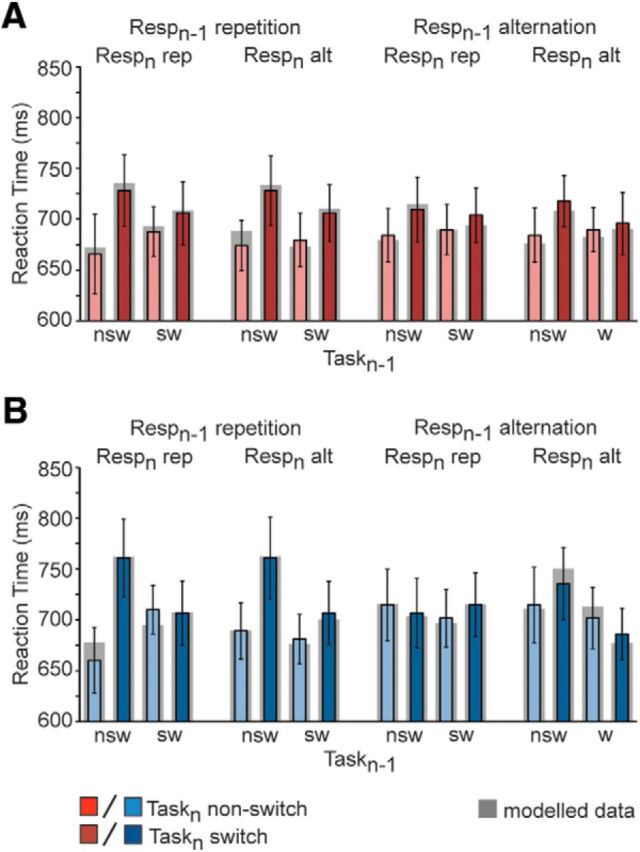
TMS experiment behavioral results. Mean RT (±SEM) interaction effect between previous and current trial task transitions as a function of trial N − 1 and trial N response transitions following 1 Hz rTMS stimulation of (A) the preSMA and (B) the SMA. Gray shading around the bars corresponds to best-fit model values. Resp, response; rep, repetition; alt, alternation; nsw, non-switch; sw, switch.