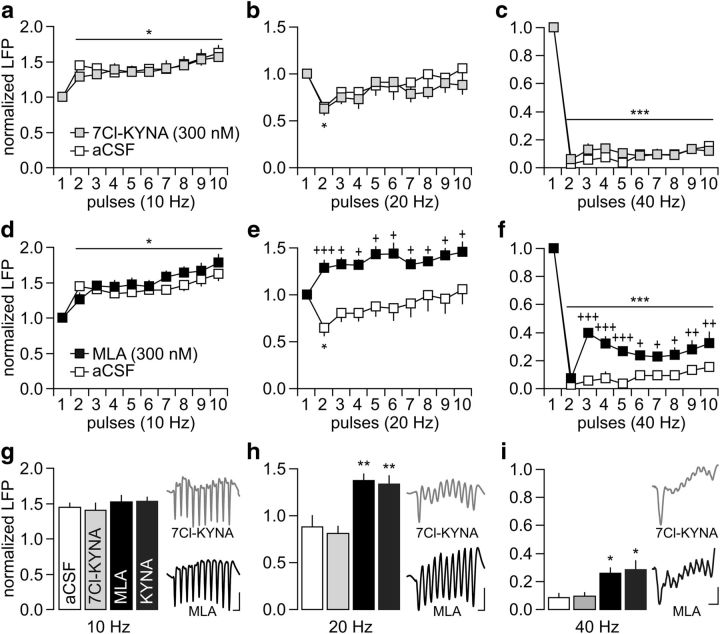
Figure 3.
PFC infusion of the α7nAChR antagonist MLA mimics the frequency-dependent disruption induced by KYNA. a–c, Summary of the results obtained after PFC infusion of 300 nm 7Cl-KYNA (n = 5). Note that the patterns of LFP response to ventral hippocampal stimulation after 7Cl-KYNA infusions are indistinguishable from the aCSF controls (*p < 0.05/***p < 0.0005 vs first pulse, LSD post hoc test after significant ANOVA). d–f, In contrast, PFC infusion of 300 nm MLA (n = 5) disrupted the LFP response at 20 and 40 Hz without altering the pattern of facilitation at 10 Hz. Two-way ANOVA revealed a main effect of pulse at 10 Hz (F(1,90) = 10.6, p < 0.0001) and main effects of treatment at both 20 Hz (F(1,90) = 54.8, p < 0.0001) and 40 Hz (F(1,90) = 95.6, p < 0.0001). A main effect of pulse (F(9,90) = 106.9, p < 0.0001) and treatment × pulse were also observed at 40 Hz (F(9,90) = 3.3, p < 0.002). LSD post hoc tests: ***p < 0.0005/*p < 0.05 versus first pulse, +++p < 0.0005/++p < 0.005/+p < 0.05 versus aCSF. g–i, Summary of the frequency-dependent LFP changes calculated from pulses 2–10 (**p < 0.005/*p < 0.05 vs aCSF or 7Cl-KYNA, Tukey's post hoc test after significant one-way ANOVA: F(3,20) = 12.4, p < 0.0001 at 20 Hz and F(3,20) = 9.5, p < 0.0005 at 40 Hz). Inset traces illustrate the pattern of LFP response following PFC infusions of 7Cl-KYNA or MLA (calibration: 5 mV/100 ms at 10 Hz; 5 mV/50 ms at 20 Hz; 5 mV/30 ms at 40 Hz).

