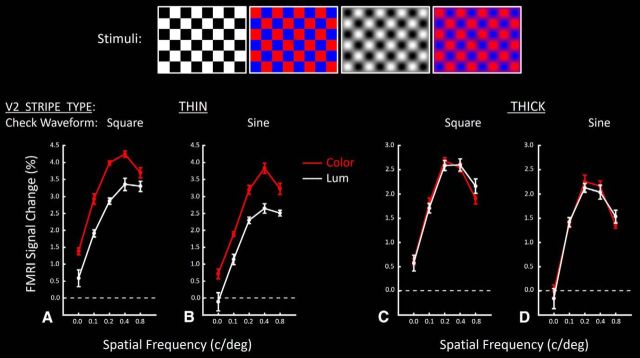
Figure 13.
Responses in V2 thin- versus thick-type stripes to contrast-reversing checkerboards. Stimuli were independently varied in three dimensions: (1) chromaticity (color- vs luminance-varying gratings; represented in red vs white functions, respectively), and (2) spatial frequency (along the x axis), and (3) waveform (square wave vs sinusoidal checks). Top panels, Four stimulus examples for a given spatial frequency. Square versus sinusoidal checks are shown in the left and right pair of panels, respectively. A, B, Responses in thin-type V2 stripes, relative to a spatially uniform gray baseline stimulus. C, D, Responses in thick-type stripes. A, C, Responses to square wave checks. B, D, Responses to sinusoidal checks.

