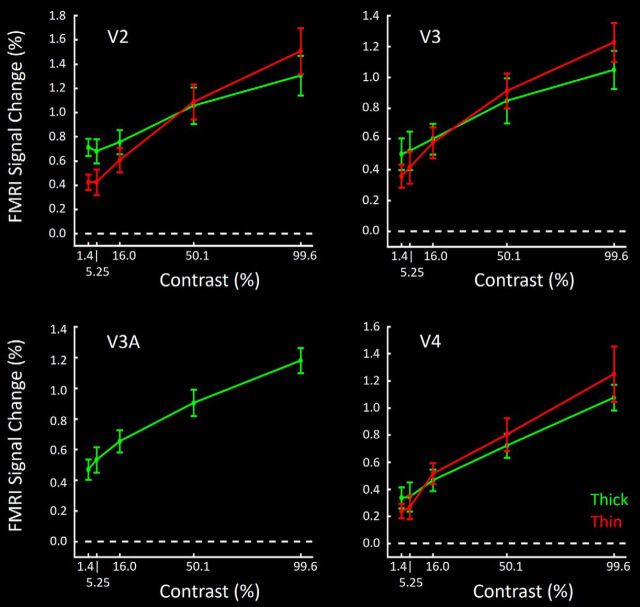
Figure 9.
Group-averaged contrast gain functions in thin- versus thick-type columns (red and green, respectively) in area V2 (top left), V3 (top right), and V4 (bottom right). In all three areas, thick-type responses show a higher y intercept, and a shallower slope compared with thin-type responses. Because V3A showed few or no color-selective columns, responses in V3A (bottom left) are shown for disparity-selective sites only.

