Fig. 2.

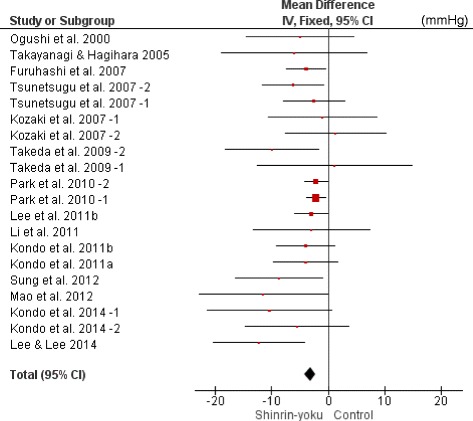
Forest plot comparing changes in SBP (mmHg) between the forest environment and the non-forest environment based on 20 studies or subgroups
CI, confidence interval.

Forest plot comparing changes in SBP (mmHg) between the forest environment and the non-forest environment based on 20 studies or subgroups
CI, confidence interval.