Fig. 4.

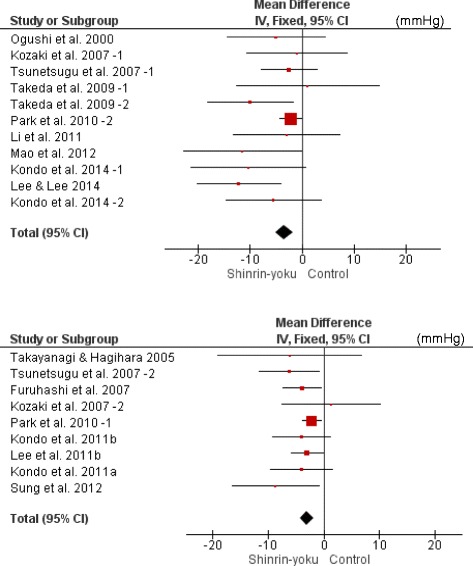
Two forest plots of the change in SBP (mmHg) in the two subgroup analyses of differences in intervention methods (walking and non-walking). 1) Walking group. 2) Non-walking group. CI, confidence interval

Two forest plots of the change in SBP (mmHg) in the two subgroup analyses of differences in intervention methods (walking and non-walking). 1) Walking group. 2) Non-walking group. CI, confidence interval