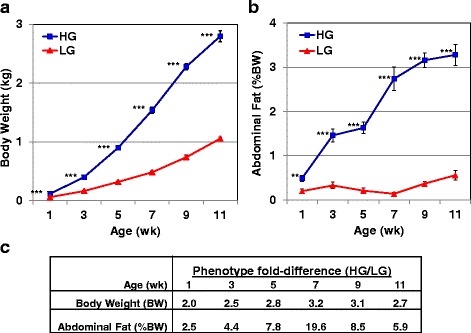
Fig. 1.

Phenotypic measurements of juvenile HG and LG chickens. Average body weight (a) of HG (blue squares) and LG (red triangles) cockerels at six ages (1-11 wk). Each symbol represents the mean ± SE of 8 individual chickens from each genotype. Average abdominal fat content (b) (% bodyweight, %BW) of 8 individual birds from the HG and LG chickens; four chickens per age and genotype were randomly selected for transcriptional analyses. Significant differences between genotypes at each age were determined using a one-way analysis of variance (ANOVA) and Tukey’s multiple comparisons procedure at a significance level of P≤0.01 (**) or P≤0.001 (***). Fold differences between genotypes (HG/LG) in body weight (kg) and abdominal fat (%BW) from 1 to 11 wk. (c). The maximum divergence in body weight and abdominal fatness occurs at 7 wk., which was the age selected for deeper RNA-Seq analysis
