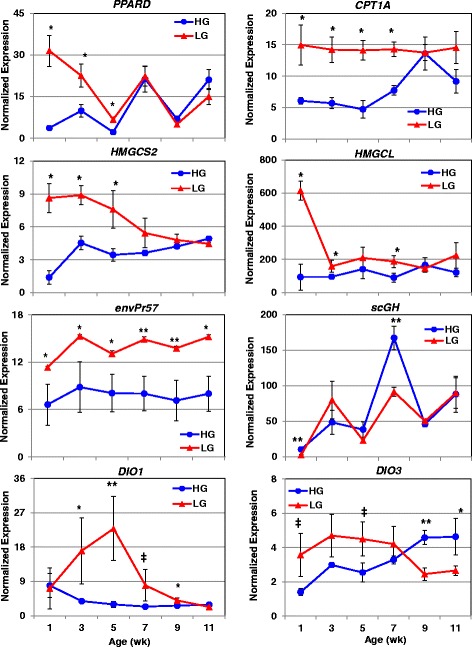
Fig. 11.

Verification of differential expression of genes associated with leanness by qRT-PCR analysis. The abundance of seven genes, expressed higher in LG birds and associated with leanness, was also verified by qRT-PCR analysis. An additional gene, short isoform of chicken GH (scGH), was included in this figure, although its expression was higher in the HG at 7 wk. Data points represent the mean ± SE of 4 birds/genotype and age. Significant differences between genotypes at each age were determined using one-way ANOVA and Tukey’s multiple comparisons procedure at significance levels of P≤0.05 (*) and P≤0.01 (**). The ‡ symbol denotes a data point that approaches significance (P≤0.10)
