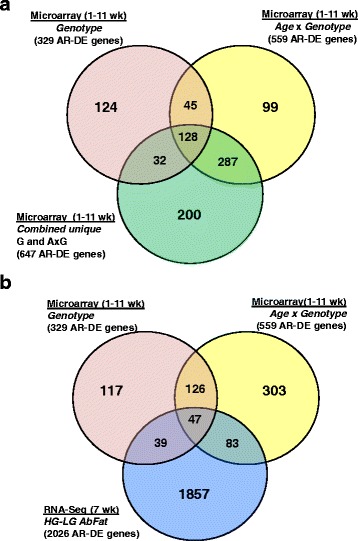
Fig. 2.

Venn diagram of “Analysis Ready” (AR) and differentially-expressed (DE) gene sets from the time-course (1-11 wk) microarray analysis (a) and RNA-seq analysis (b) of abdominal fat in HG and LG cockerels (7 wk). Three statistical contrasts were made for the microarray analysis: the main effect (FDR ≤ 0.05) of genotype (HG vs. LG) across 6 ages (1-11 wk), age x genotype interaction and the main effect of age. An additional non-redundant gene set (combined-unique, 647 AR-DE genes), used for Ingenuity® Pathway Analysis (IPA), was assembled by combining the genotype (329 AR-DE genes) and age x genotype (559 AR-DE genes) datasets, then removing and duplicate genes (cDNAs) printed on the 14 K Del-Mar chicken microarray. The Venn diagrams represent the number of AR-DE genes annotated in the Ingenuity® Knowledge Base. The common genes shown in intersects were also combined and used for IPA. The RNA-seq analysis provided 2026 AR-DE genes (FDR ≤ 0.05), which were used for IPA and comparison with time-course microarray datasets (b)
