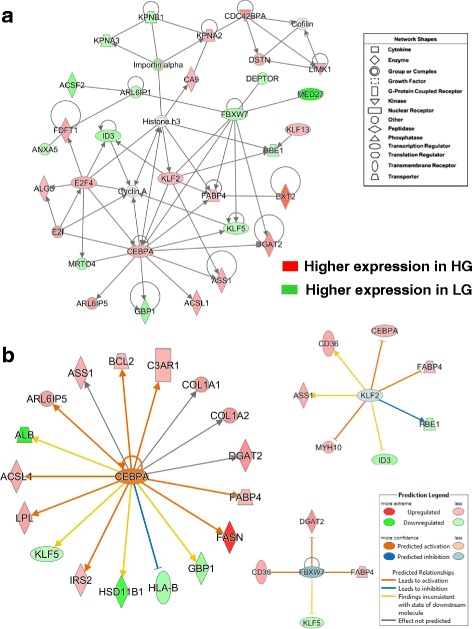
Fig. 4.

This adipogenic gene network is centered on the up-regulated transcription factor CEBPA and interactions with several other transcription regulators (a). Another major gene interaction network identified by a time-course microarray analysis of abdominal fat of HG and LG chickens (1-11 wk). Ingenuity Pathway Analysis (IPA) identified this functional gene interaction network from the unique set of 647 AR-DE genes shown in the Venn diagram (Fig. 2a). Red gene symbols indicate higher expression in HG adipose tissue, while green gene symbols indicate higher expression in visceral fat of the LG. The Ingenuity® Upstream Regulator Analysis determined additional direct target genes of CEBPA, KLF2 and FBXW7 (b). Ingenuity predicts the activation of CEPBA (orange gene symbol and arrows) and inhibition of KLF2 and FBXW7 (blue symbol and arrow)
