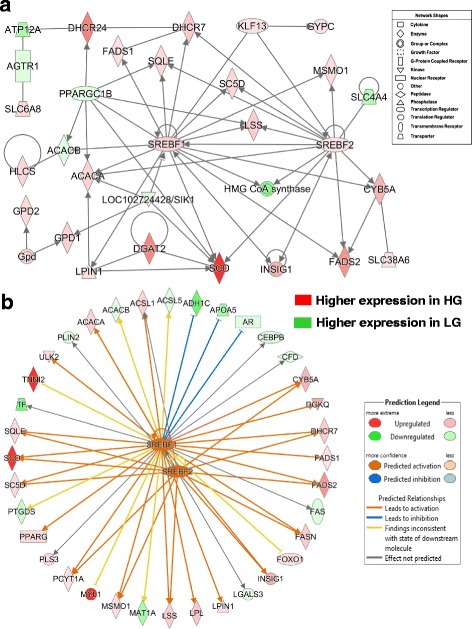
Fig. 7.

IPA of RNA-Seq data revealed a gene network controlled by the lipogenic transcription factors SREBF1 and SREBF2 (a). Panel b shows additional direct gene targets that are either unique to, or shared by, SREBF1 (35 DE genes) and SREBF2 (16 DE genes). The Ingenuity® Upstream Analysis predicates activation (orange arrows and symbols) or inhibition (blunt blue line) of direct target genes. The predicted activated (orange arrows) or inhibited (blunt blue lines) state of DE target genes is based on the expected responses accrued in the Ingenuity Knowledge Base
