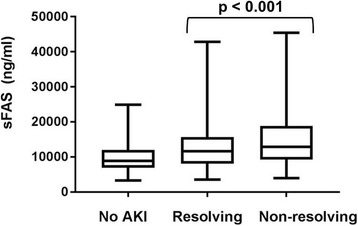
Fig. 1.

Soluble Fas (sFas) biomarker levels in the study cohort. Box plots showing median, interquartile range (box), and upper and lower adjacent values (bars) for biomarker levels, stratified by no acute kidney injury (AKI), resolving acute kidney injury, and nonresolving acute kidney injury. p Value is for comparison of resolving with nonresolving AKI
