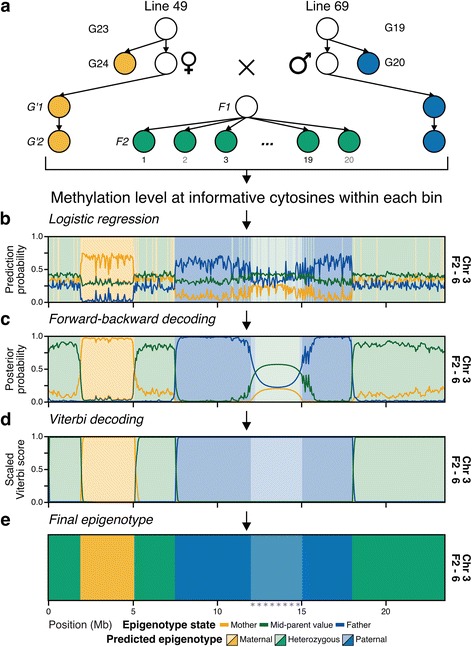
Fig. 2.

Set-up of MA line 49 × line 69 and overview of epigenotyping procedure. a Experimental set up for genetic cross of A. thaliana Col-0 MA line 49 × line 69. Filled circles indicate WGBS data are available. After obtaining methylation level of all informative cytosines for a bin for all samples, b use logistic regression classifier to get initial epigenotype predictions and probabilities for classifiers mother, mid-parent, and father for each bin. c Then, apply forward-backward algorithm to find the most likely epigenotype at each bin. d Next, apply the Viterbi algorithm to find the most likely sequence of epigenotypes across the chromosome. d The resulting map of the Viterbi algorithm is used as the final predicted epigenotype. For b–e, background color indicates epigenotype prediction at each step. Line indicates prediction probability, posterior probability from forward-backward algorithm, and scaled score from the Viterbi algorithm. Maternal epigenotype is shown in yellow, mid-parent/heterozygous green, and paternal blue. Centromere is denoted by gray stars and lighter background color
