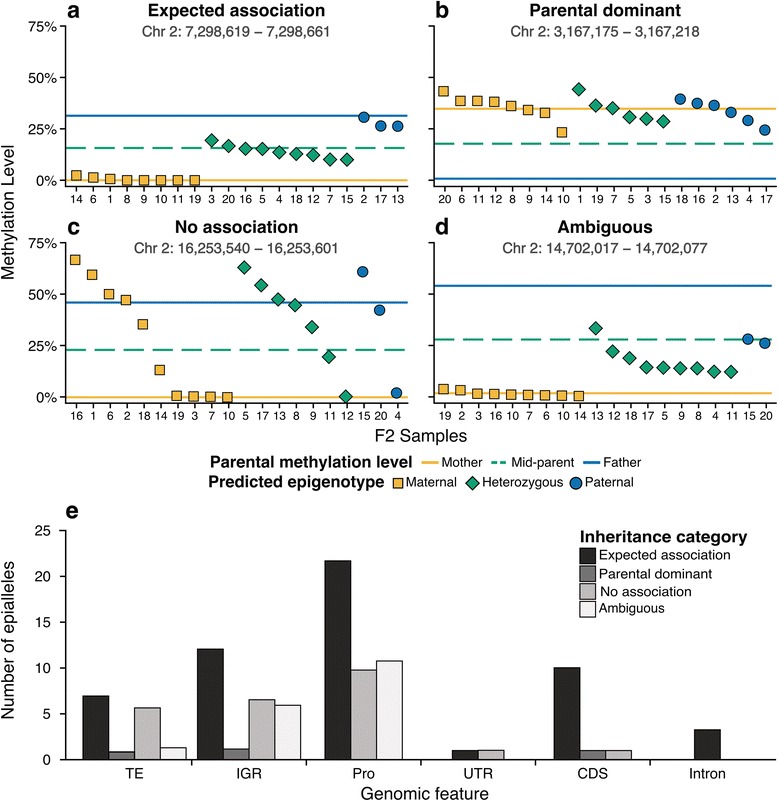
Fig. 5.

Inheritance patterns of epialleles. Examples of a expected, b parental dominant, c no association, and d ambiguous DMRs identified. Yellow and blue lines indicate methylation level for mother and father, respectively. Green dashed line is the computed mid-parent methylation level. Yellow square, green diamond, and blue circle indicate predicted epigenotype of each F2 individual at the DMR as maternal homozygous, heterozygous, and paternal homozygous, respectively. e Distribution of underlying genomic characteristics of regions identified by inheritance category. Abbreviations: TE transposable element, IGR intergenic region, Pro promoter, UTR untranslated region, CDS coding sequence
