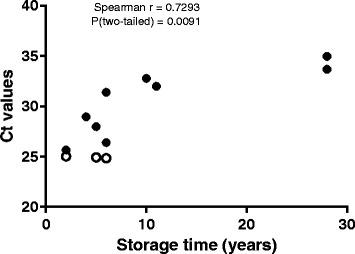
Fig. 1.

The association between increasing storage time and Ct values of endogenous control HBB in lung tissue from FFPE and FF tissue samples. y-axis show Ct values for HBB gene in lung tissue and x-axis the age of lung tissue at DNA isolation time. The association between increasing storage time and Ct shown as r (spearman) = 0.73, p = 0.009. Empty circles are FF tissue samples. Filled circles represent FFPE tissue samples
